Workflows
Automate across all your connected accounts with sandboxed TypeScript — triggered manually, on a schedule, or from git.
Workflows let you script actions across every account you’ve connected to Infrawrench. A workflow is a TypeScript file you edit in a full Monaco editor with autocomplete generated from your accounts, run inside a secure V8/WASM isolate on desktop, on the web app, and through the web proxy.
The classic example: grab a config file from a Cloudflare R2 bucket, parse it as JSON, and use those values to update DNS records or a database — all in a few lines, with full type-checking.
The infra object
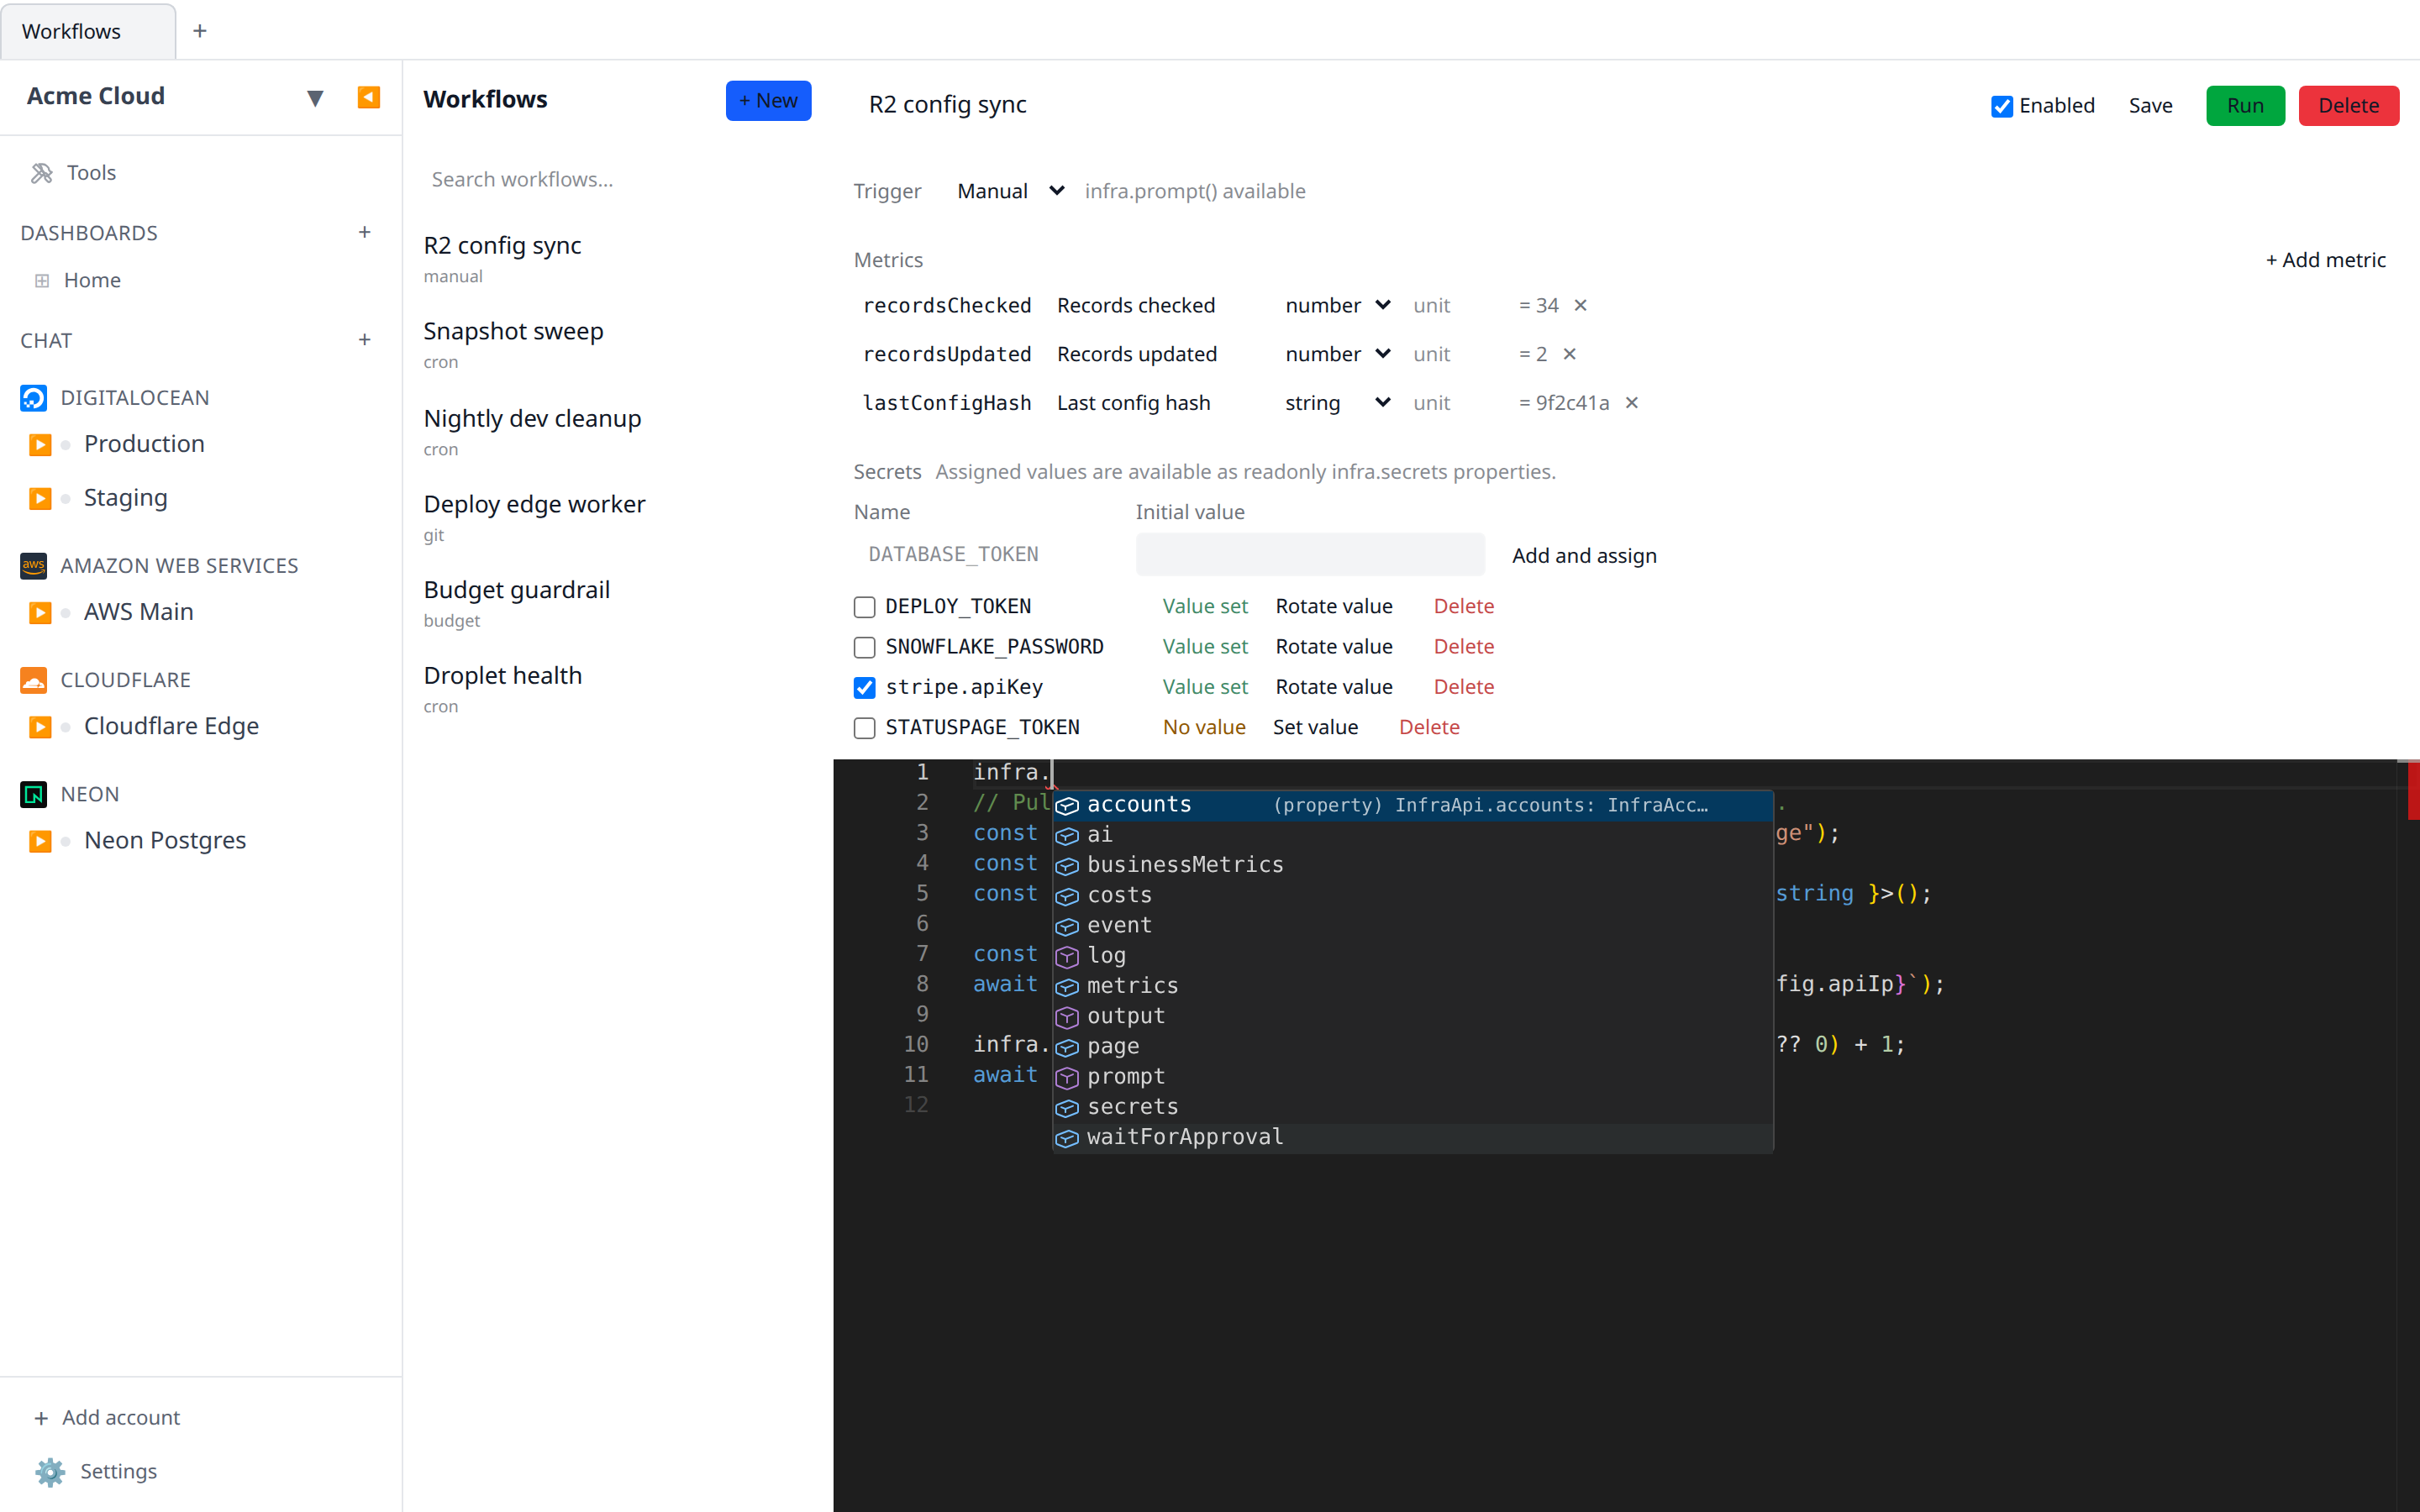
Every workflow runs with a global infra object. Its types are generated from your connected accounts, so autocomplete shows exactly the providers, accounts, and resource types you actually have.
Accounts and resources
// Look an account up by the display name you gave it
const cf = infra.accounts.cloudflare.getByName("production");

// Each resource type is a typed group on the account, named after the type:
const buckets = await cf.r2Buckets.list();
const zone = await cf.zones.get("example.com");
await cf.dnsRecords.create({ type: "A", name: "api", content: "1.2.3.4" });

// Resolve an output (e.g. a server's IP) for use elsewhere
const ip = await infra.accounts.hetzner
  .getByName("eu-central")
  .resolveOutput("server", serverId, "ipv4");
infra.accounts.<plugin> exposes list(), getById(id), and getByName(name). Each account handle is built from the provider’s resource types: every type is a group named after its (plural) name — account.<type>.list() and account.<type>.get(id), plus .create/.update/.delete(...) for the operations that provider actually supports (read-only types get just list/get). Account-level resolveOutput(...) is also available.
Every resource you get back also carries delete() (delete this resource), the SSH helpers below, and the extended capabilities a resource supports in the detail page — each throws a clear error if that provider/resource doesn’t support it:
const droplet = await infra.accounts.digitalocean.getByName("prod").droplets.get(id);
await droplet.delete(); // same as droplets.delete(droplet.id)

// SQL query (REST query engines, e.g. BigQuery)
const { rows } = await dataset.query("SELECT count(*) FROM events");

// Key-value / Redis namespaces
await kvNamespace.kv.set("flag", "on");
const flag = await kvNamespace.kv.get("flag");
const { items } = await kvNamespace.kv.list({ prefix: "user:" });

// Document stores (Firestore / MongoDB / DynamoDB)
await collection.nosql("deleteDocument", ["users", "123"]);

// Kubernetes-style logs + describe + manifests
const { text } = await pod.logs({ tailLines: 200 });
const summary = await pod.describe();
await deployment.applyManifest(updatedYaml);
await infra.accounts.digitalocean.getByName("prod").importYaml(manifest); // kubectl apply -f

// Pub/sub publish + provider metrics
await queue.publish("hello"); // or { body, extras }
const series = await droplet.metrics({ startMs, endMs });

// SFTP (over the resource's SSH endpoint — same key handling as ssh())
const entries = await droplet.sftp.list("/var/log");
await droplet.sftp.put("/tmp/app.env", "KEY=value\n");
const bytes = await droplet.sftp.get("/etc/os-release"); // Uint8Array
const text = await droplet.sftp.get("/etc/os-release", { encoding: "utf8" }); // string
await droplet.sftp.mkdir("/tmp/data");
await droplet.sftp.delete("/tmp/old", { recursive: true });
These mirror the detail page’s SQL editor, Keys/KV tab, document browser, Logs/Describe tabs, manifest editor, Publish tab, and Metrics — exposed as plain methods on the resource handle. Each method only appears on the resource types that actually support it (autocomplete won’t offer .ssh() on a DNS record or .kv on a droplet), so the editor shows you exactly what a given resource can do.
create() is typed from the real form. Rather than a generic Record<string, string>, the fields argument is generated from the provider’s actual create form — so the editor autocompletes the real field keys, and where a field has a closed set of choices (regions, sizes, images, plain selects) you get those values as literal suggestions. Creating a DigitalOcean droplet, for example, autocompletes name, region, size, image, and the SSH-key field, with the live region/size/image ids as options:
const droplets = infra.accounts.digitalocean.getByName("prod").droplets;
const droplet = await droplets.create({
  name: "web-1",
  region: "nyc3", // ← suggested from your account's live region list
  size: "s-1vcpu-1gb",
  image: "ubuntu-24-04-x64",
  sshPublicKey: "deploy-key", // ← suggested from your Infrawrench SSH keys (by name)
});
Options come from the provider’s live catalog, so any other string still type-checks (the union is open) — you just lose the autocomplete hint.
SSH-key fields reference your Infrawrench keys. A provider’s SSH-key field (and the sshKey option on resource.ssh(...), below) autocompletes the names of the SSH keys you manage in Infrawrench — the same list shown by the SSH-key picker, refreshed each time the editor loads types, so a key you just added appears immediately. You can give it a key name (Infrawrench resolves it to that key’s public key before the provider sees it) or paste a raw public key directly — both work.
Inside a cluster or managed database
Some resources are containers for other resources. A managed Kubernetes cluster (DOKS, EKS, GKE, AKS, Kapsule) hands out a kubeconfig, so everything the Kubernetes plugin can do works inside it; a managed database hands out a connection string, so the postgres / mysql / redis / mongodb plugins work inside it. These are the same sidecars you see as extra tabs on the resource’s detail page.
In a workflow they appear as a property on the parent resource, named after the peer plugin:
const gcp = infra.accounts.gcp.getByName("production");

for (const cluster of await gcp.gkeClusters.list()) {
  for (const pod of await cluster.kubernetes.pods.list()) {
    if (Number(pod.fields.restarts) > 3) {
      await infra.page(`${pod.displayName} has restarted ${pod.fields.restarts} times`, {
        key: `pod-restarts-${pod.id}`,
      });
    }
  }
}

// Managed databases work the same way
const instance = await gcp.cloudSQLInstances.get(instanceId);
const databases = await instance.postgres.postgresqlDatabases.list();
Inside the sidecar everything reads exactly like an account’s own resources — list(), get(id), create/update/delete(...) where the peer supports them, and the extended capabilities each type has, so pod.logs() and pod.describe() are right there. The parent’s credentials are resolved for you at each call; you never handle the kubeconfig or connection string yourself.
A resource type declares every peer it can expose, so a Cloud SQL instance offers both .postgres and .mysql in the editor even though any given instance runs one engine. Reaching for the wrong one fails at the call with a clear error, the same way an unsupported capability does.
Two things a sidecar’s resources don’t get, because both are properties of the account rather than of the peer: ssh()/sftp (which need an SSH endpoint on the resource type) and bucket reads. The editor won’t offer them.
A sidecar’s capabilities are discovered by reaching into one real parent, so they only appear once you actually have a cluster (or database) of that type — create your first one and the next time the editor loads its types, pod.logs() is there.
Sidecars don’t nest — the things inside a cluster don’t have clusters of their own.
Reading storage objects
Storage-capable resources (e.g. buckets) come back with object read methods on them — fetch the bucket, then read its objects:
const cf = infra.accounts.cloudflare.getByName("production");
const bucket = await cf.r2Buckets.get("configs");
const file = await bucket.get("app.json");
const config = file.json<{ replicas: number }>();
infra.log("replicas:", config.replicas);

// list objects under a prefix
const logs = await bucket.list("logs/");
The object from bucket.get(key) exposes .text(), .json<T>(), and the raw .base64; bucket.list(prefix?) enumerates objects.
SSH into a resource
Any resource that exposes an SSH endpoint (a DigitalOcean droplet, a Hetzner/EC2 server, …) can be connected to right from a workflow. The common pattern is create with a key → wait for it to come up → connect:
const droplets = infra.accounts.digitalocean.getByName("prod").droplets;

// 1. Create the box with an Infrawrench SSH key attached (it boots with your key)
const droplet = await droplets.create({
  name: "build-runner",
  region: "nyc3",
  size: "s-2vcpu-4gb",
  image: "ubuntu-24-04-x64",
  sshPublicKey: "deploy-key", // a key name from your Infrawrench SSH keys
});

// 2. Wait until it accepts SSH (polls until reachable, or times out)
await droplet.waitUntilReachable();

// 3. Connect and run a command — resolves the full stdout as a string.
//    No sshKey needed: a resource you just created remembers the key you
//    attached, so ssh() uses it automatically.
const uname = await droplet.ssh("uname -a");
infra.log(uname.trim());
The implicit key only applies to resources returned from create() (where you attached the key). For a resource you fetched with get()/list(), pass { sshKey: "<name>" } explicitly — Infrawrench has no way to know which key you intend.
resource.ssh(command, opts) is a single combined call:
-
Await the full result — resolves a
string(or aUint8Arraywith{ encoding: "binary" }):const text = await droplet.ssh("cat /etc/os-release", { sshKey: "deploy-key" }); const bytes = await droplet.ssh("cat /tmp/blob", { sshKey: "deploy-key", encoding: "binary" }); -
Stream output — pass
{ stream: true }to get a{ stdout, stderr }object. Each is a byte stream (async-iterable, with agetReader()); the object itself iteratesstdoutfor convenience:const streams = droplet.ssh("journalctl -f", { sshKey: "deploy-key", stream: true }); // Iterate stdout / stderr separately… for await (const chunk of streams.stderr) { infra.log("err:", new TextDecoder().decode(chunk)); }Tail straight to the run log — pass the whole streams object to
infra.log(...)and it streams both channels to the log as they arrive, line by line, with stdout in the normal colour and stderr in red:await infra.log(droplet.ssh("apt-get update", { sshKey: "deploy-key", stream: true }));
(encoding applies to the awaited result, not to streams — stream chunks are always raw bytes.)
infra.log(...) also accepts a Uint8Array (or ArrayBuffer) directly and decodes it as UTF-8 text — so logging raw bytes from sftp.get or a binary ssh() result prints the content, not a {"0":104,…} dump. It also awaits any promise you pass it, so you can hand it an unawaited ssh() / sftp.get() call directly:
await infra.log(droplet.sftp.get("/etc/os-release")); // awaits the read, then prints the file's textOptions: sshKey (an Infrawrench SSH key by name or id — autocompleted from your keys; its private half authenticates; not needed for providers with native SSH like Fly/Hetzner), username (defaults to the resource type’s SSH user, e.g. root), encoding, stream, timeoutMs, and skipHostKeyCheck (accept whatever host key is presented without verifying or pinning it — handy for ephemeral hosts that get recreated with the same address, but it turns off MITM protection, so only use it on a trusted path).
waitUntilReachable({ timeoutMs?, port? }) polls until the host accepts TCP on the SSH port — it keeps re-resolving the address too, so it works on a freshly-created VM that doesn’t have an IP yet (it doesn’t fail the instant the address is missing). It defaults to a few minutes before giving up. A workflow run has a generous wall-clock budget (5 minutes by default, which counts time spent waiting), enough to create a VM, wait for boot, connect, and clean up.
Host keys are trusted on first use for workflow connections and pinned; if a previously-seen host’s key later changes, the connection is refused until you re-pin it (or pass { skipHostKeyCheck: true }). On the desktop app an unknown host key shows a confirmation dialog — while it’s open, the run’s time budget is paused, so taking a moment to confirm doesn’t eat into the execution timeout (SSH and waitUntilReachable() waits are excluded from the budget for the same reason). SSH is available for manual and automated runs alike.
Prompting the user
For manual runs you can ask the user for input mid-workflow:
const env = await infra.prompt({
  message: "Which environment?",
  kind: "select",
  options: [
    { label: "Staging", value: "staging" },
    { label: "Production", value: "production" },
  ],
});
kind can be text (default), password, number, boolean, select (with options), or code — a multiline code editor for pasting in a snippet, JSON, a manifest, etc. (Tab indents; ⌘/Ctrl+Enter submits):
const manifest = await infra.prompt({
  message: "Paste the deployment manifest",
  kind: "code",
});
infra.prompt(...) is only available for manual runs. Automated (cron/git) runs are non-interactive — calling it there throws, and the generated types mark it unavailable so you catch it while editing.
Output and logging
infra.log("starting reconcile");
await infra.output({ updated: 3 }); // shown in the run result
Calling an HTTP API
fetch is available as a global, and works the way you’d expect:
const res = await fetch("https://api.example.com/v1/incidents", {
  method: "POST",
  headers: { authorization: `Bearer ${token}`, "content-type": "application/json" },
  body: { title: "disk 90% full", severity: "warning" },
});
if (!res.ok) throw new Error(`incident API returned ${res.status}`);
const created = await res.json<{ id: string }>();
await infra.log(`opened incident ${created.id}`);
This is what lets a workflow talk to things Infrawrench has no plugin for — a status page, a ticketing system, an internal service with an HTTP API, a vendor’s billing export you then hand to infra.costs.write.
It is a deliberately small subset of the browser’s fetch:
| Difference | Why |
|---|---|
The body is fully buffered — text()/json()/bytes() re-read | No streaming across the isolate boundary; in exchange the body isn’t single-use. |
A non-string, non-bytes body is JSON-encoded automatically | With content-type: application/json unless you set that header yourself. |
Two extra options: timeoutMs (default 30s) and maxBytes (5 MiB) | Every request has to end, and a response bigger than the cap fails rather than truncating. |
No Request/Headers constructors, no cookies, no signal | Nothing in a workflow needs them; less surface to get wrong. |
Methods are limited to GET, HEAD, POST, PUT, PATCH, DELETE, and OPTIONS, and connection-level headers (host, content-length, transfer-encoding, …) can’t be set.
Where the request comes from is not where your workflow runs. In the cloud, workflow code executes on our Kubernetes cluster, so making its HTTP requests from there would put that cluster’s internal network one fetch() away from any workflow. Instead the request is handed to a proxy that runs outside the cluster entirely, and only the public internet is reachable through it. Private and loopback addresses (10.0.0.1, 127.0.0.1, 169.254.169.254), cluster-internal names (*.svc, *.cluster.local, *.internal), and non-HTTP schemes are refused — including on a redirect, so a public URL can’t bounce you somewhere private. You’ll see the refusal in the run log:
fetch() failed: 169.254.169.254 is a private address and is not proxied.To reach something on a private network, give the workflow a path to it that you control — an SSH command on a resource that can see it (resource.ssh), or a tunnel — rather than expecting fetch to route there.
In a local desktop workflow there’s no cluster and no proxy: the request is made directly from your own machine, so your LAN and localhost are reachable. A workflow that hits http://192.168.1.10:9200/ works locally and is refused in the cloud — worth remembering if you recreate it in an organization, since organization workflows run on the cloud host even when you edit them from the desktop app.
A run can make up to 250 requests, and time spent in fetch counts against the run’s execution budget (unlike SSH waits, which are excluded) — so a loop that polls an API can’t outlive the run.
Asking a model for help
Cloud feature — the call is made server-side with the deployment’s API key, so it’s unavailable in local desktop workflows, and it’s metered like AI chat.
Some steps need judgement rather than a rule: is this log tail alarming, which of these errors are the same incident, what should the page actually say. infra.ai(...) sends one prompt to a model and resolves with its reply:
// Cron: hourly. Let the model read the log tail before waking anyone up.
const cluster = infra.accounts.kubernetes.getByName("prod");
for (const pod of await cluster.pods.list()) {
  const restarts = Number(pod.fields.restarts ?? 0);
  if (restarts <= 5) continue;
  const { text } = await pod
    .logs({ tailLines: 200 })
    .then((l) =>
      infra.ai(
        `These are the last 200 log lines of a crash-looping pod. In two sentences, what is failing and does it look self-inflicted (bad config, OOM) or external (dependency down)?\n\n${l.text}`,
      ),
    );
  await infra.page(`${pod.displayName} restarted ${restarts} times. ${text}`, {
    key: pod.displayName,
  });
}
The model sees only what you pass it. Unlike writing workflows with an AI client, infra.ai is not an agent: it has no tools, no access to your accounts or resources, and no memory between calls. Paste the material you want it to work from — a log tail, a diff, a list of alerts — into the prompt.
| Option | Default | What it does |
|---|---|---|
model | "claude-sonnet-5" | Also "claude-haiku-4-5" (fastest, cheapest) or "claude-opus-5" (most capable). |
system | none | A system prompt framing how to answer (“Reply with one word: PAGE or IGNORE.”). |
maxTokens | 1024 | Cap on the reply length, up to 8192. Check stopReason === "max_tokens" for cutoffs. |
The result carries text, the concrete model that answered, stopReason ("end" or "max_tokens"), the token counts, and costMicros — what the call cost in millionths of a dollar.
Billing. Calls are metered exactly like AI chat and draw from the same monthly AI spend pool: the org’s configured cap, or the $5/month free tier for orgs without a paid plan. Once the pool is spent, infra.ai throws (and so does chat) until the cap is raised or the month rolls over. Chat turns and workflow runs share one reservation lock before each model call so concurrent consumers cannot all clear the same below-cap check; in-flight holds are refreshed while the call runs and expire within minutes if a process dies mid-call. Stopping a run cancels an in-flight request and drops its reservation. A prompt is billed as input tokens, so mind what a cron loop feeds it — an hourly workflow that sends 200k characters to Opus adds up.
Limits: 20 calls per run, prompts up to 200,000 characters, and a per-call timeout of two minutes. Time spent waiting on the model does not count against the run’s execution budget (like SSH waits, unlike fetch) — the call cap is what bounds an infra.ai loop.
If the model declines to answer (a safety refusal), the call throws rather than resolving with an empty string, so a branch on the reply can’t silently take the wrong arm — catch it if you have a fallback.
Paging a human
A workflow that finds a problem can wake someone up. infra.page(...) delivers to the same recipients as sync-failure incidents and budget alerts: SMS (and optionally a voice call) through your org’s Twilio credentials, mobile push to everyone who has the app installed, and any Slack or Microsoft Teams channels opted into pages. Configure who receives them under Settings → Notifications.
// Cron: hourly. Page when a pod's restart count runs away.
const cluster = infra.accounts.kubernetes.getByName("prod");
for (const pod of await cluster.pods.list()) {
  const restarts = Number(pod.fields.restarts ?? 0);
  if (restarts > 5) {
    await infra.page(`${pod.displayName} has restarted ${restarts} times`, {
      title: "Pod restarts",
      key: pod.displayName,
    });
  } else {
    // Recovered — re-arm this pod so a fresh spike pages immediately.
    await infra.page.clear(pod.displayName);
  }
}
Repeat pages are throttled, so call it unconditionally. A monitoring cron re-finds the same problem on every tick; if each tick paged, an hourly check would send 24 messages a day about one broken pod. Instead every page carries a key, and a page under a key that has already fired is suppressed until its cooldown elapses — one hour by default. The check above is meant to run every hour and page once.
Choose the key to match what you’re watching. The example uses the pod name, so ten unhealthy pods produce ten pages and one flapping pod can’t mute the other nine. Omit key and everything shares a single key called default, which is the right choice when the workflow watches one thing.
| Option | Default | What it does |
|---|---|---|
title | the workflow’s name | Headline of the push notification. |
key | "default" | Throttle bucket. Pages sharing a key suppress one another. |
cooldownMinutes | 60 | How long a key stays quiet after firing. 0 sends on every call. |
voice | false | Also place a Twilio voice call to recipients who opted into voice. |
The returned object tells you what happened — delivered, suppressed, how many sms, push, slack, and msTeams deliveries landed, and retryAt when it was suppressed:
const result = await infra.page("nightly backup did not complete");
if (result.suppressed) infra.log(`already paged; quiet until ${result.retryAt}`);
infra.page.clear(key) drops a key’s cooldown. Call it when the condition recovers so the next occurrence pages immediately instead of waiting out a stale timer. A cooldown is only started by a page that actually reached somebody — if every transport fails, the next run tries again rather than going quiet.
A server that runs outside Infrawrench can raise the same page over HTTP — see Push from your own servers. Keys and cooldowns are scoped per source there, so an API caller and a workflow never throttle each other.
In a local desktop workflow there are no Twilio, push, Slack, or Teams recipients — those connections are org-level things the cloud holds — so a page becomes a native OS notification on the machine running the workflow. The key and cooldown behave exactly the same. An organization’s workflows page the full set of transports whether you run them from the web or the desktop app.
Pausing for a human approval
Some steps shouldn’t run just because a script reached them. infra.waitForApproval(...) suspends the run mid-flight until a member of your organization approves or denies it:
// Cron: nightly cleanup, but a human signs off before anything is deleted.
const gcp = infra.accounts.gcp.getByName("production");
const stale = (await gcp.gkeClusters.list()).filter((c) => c.displayName.startsWith("dev-"));

if (stale.length > 0) {
  await infra.waitForApproval(`Delete ${stale.length} dev cluster(s)?`, {
    title: "Nightly dev cleanup",
    timeoutMinutes: 120,
  });
  for (const cluster of stale) await cluster.delete();
}
While the run is suspended, the request shows up as a pending approval card on the workflow’s run view with Approve and Deny buttons, and it is announced on every channel the organization has set up (see below). Approving lets the run continue within a few seconds; the call resolves with { approved: true, decidedBy, decidedAt } so you can log who signed off.
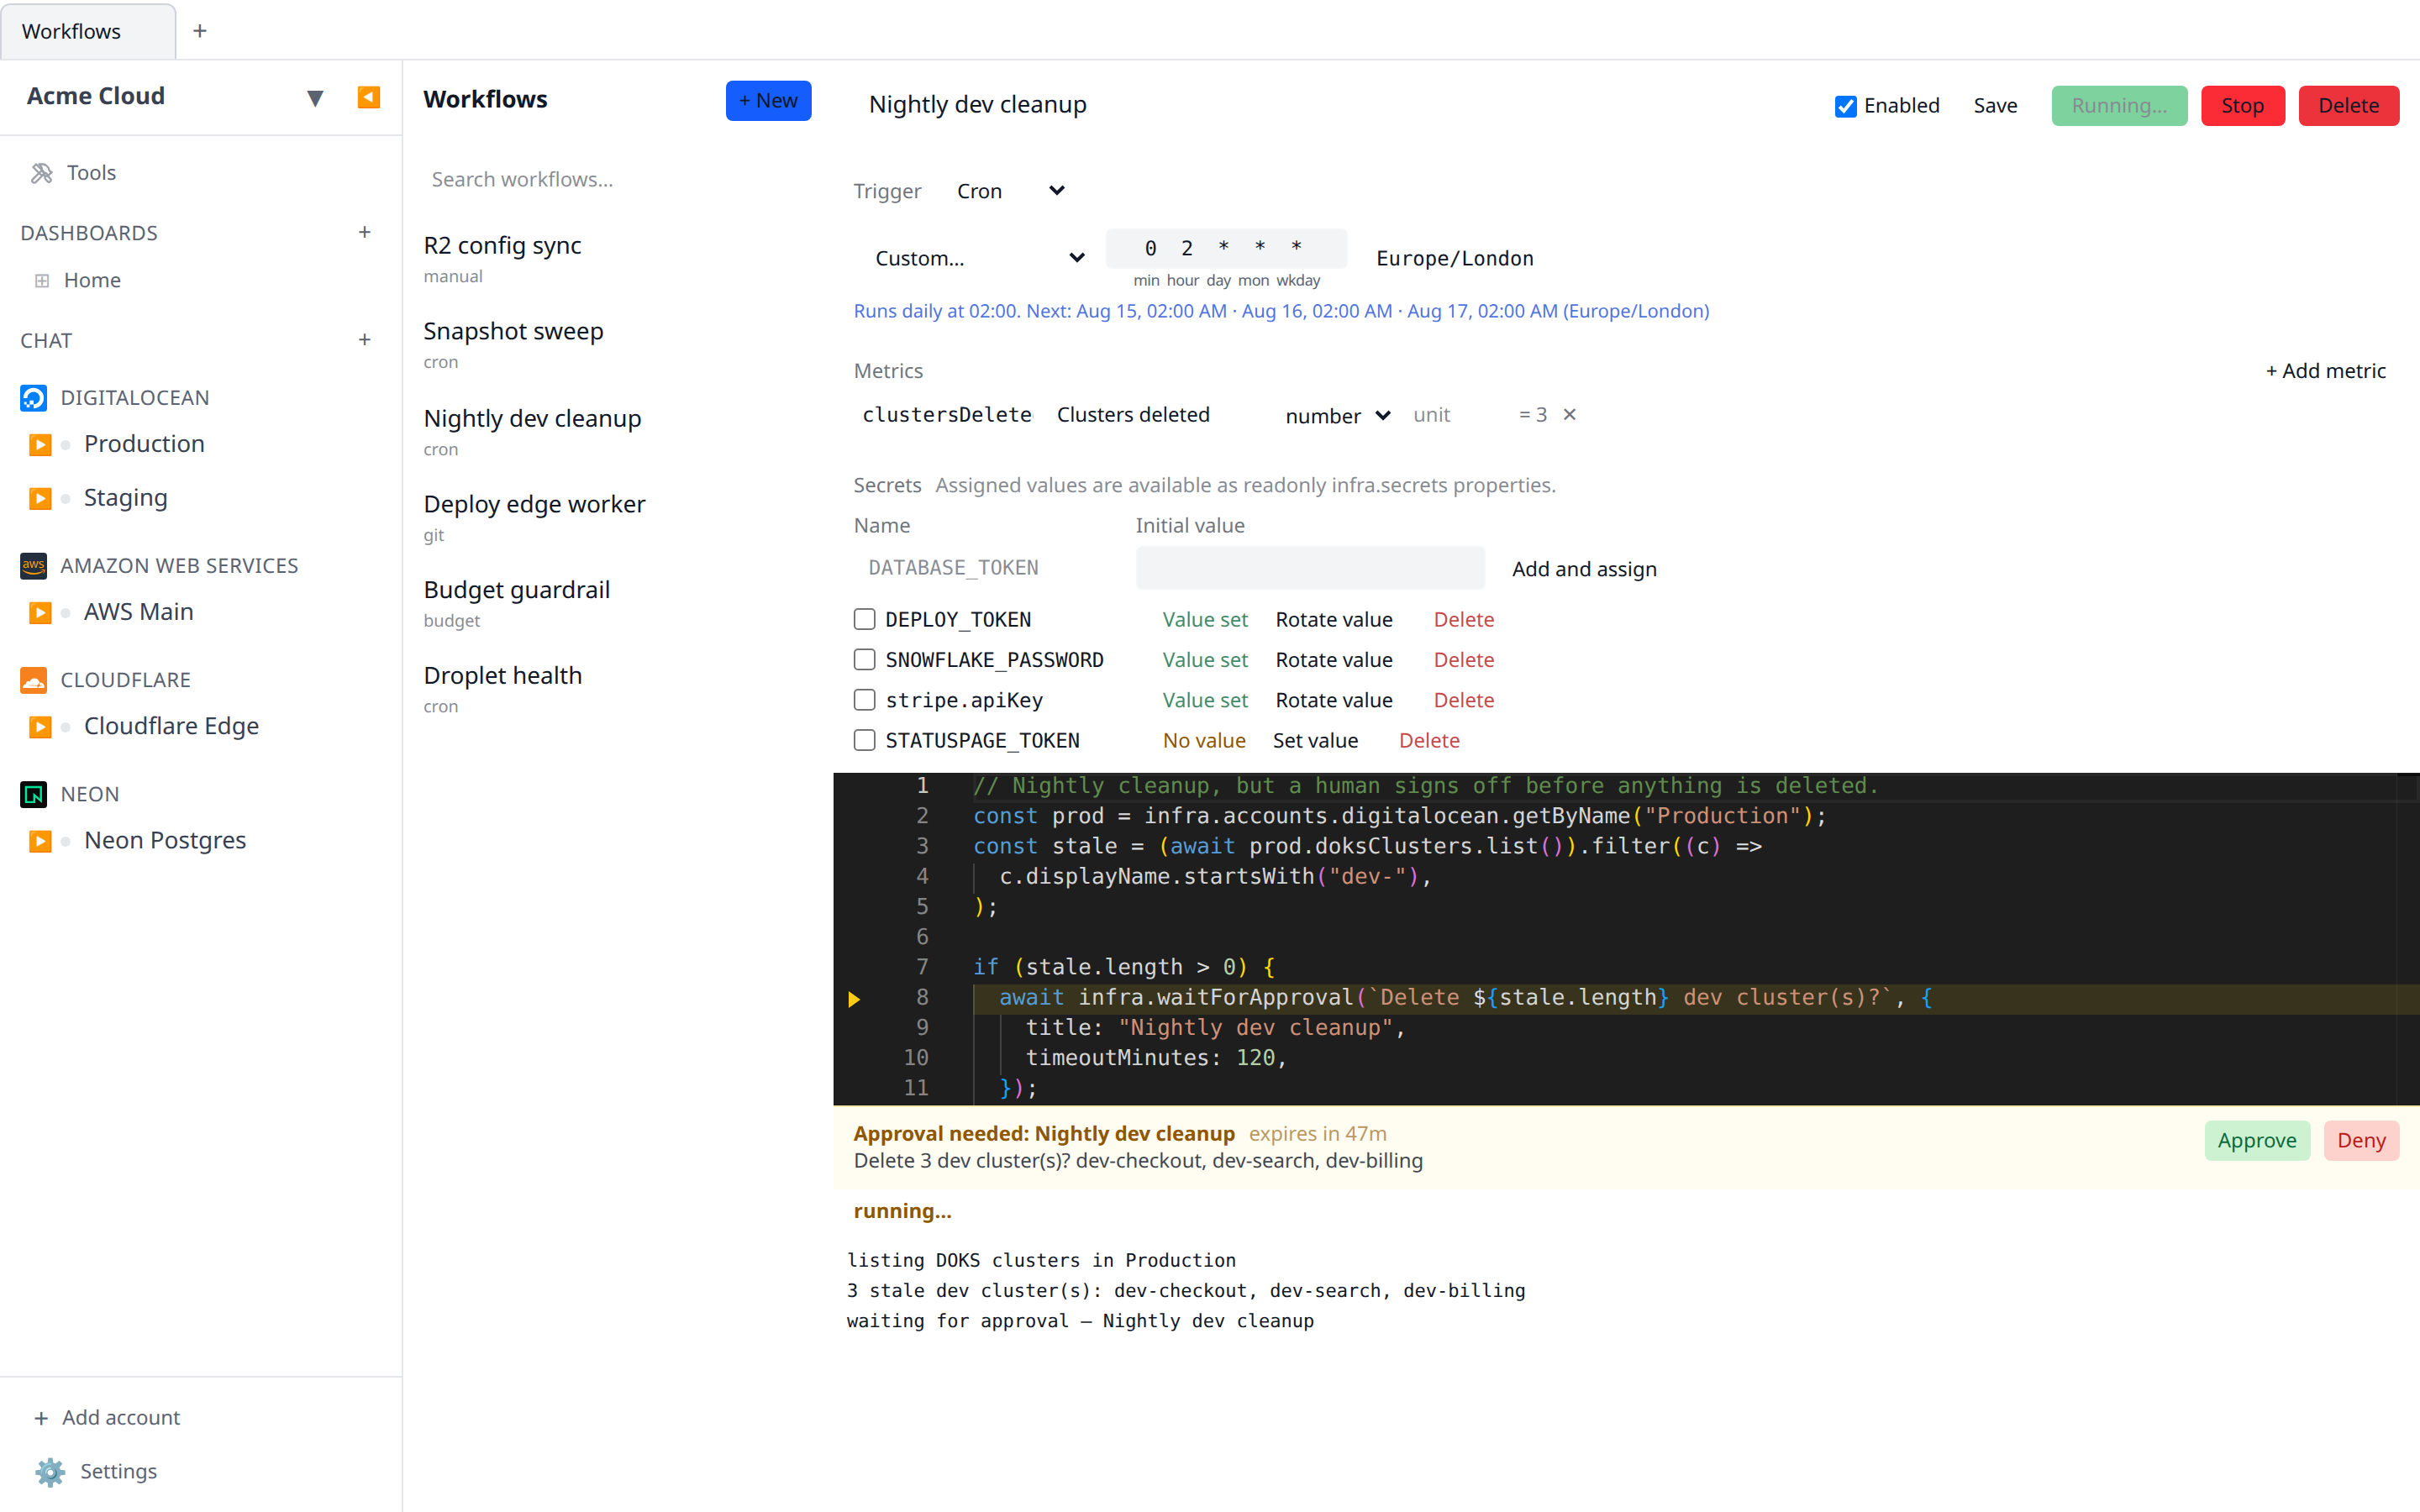
Denial and timeout throw. If someone denies the request — or nobody decides before the timeout (60 minutes by default, up to 24 hours) — the waitForApproval call throws and the run fails, unless you catch the error to take a fallback path. There is no “approve by silence”: an unattended request is always treated as denied.
| Option | Default | What it does |
|---|---|---|
title | the workflow’s name | Headline of the approval card and of every notification. |
timeoutMinutes | 60 | How long to wait before the request expires and is denied. |
Time spent waiting for a decision doesn’t count against the run’s execution budget (like SSH waits and infra.prompt), so a run can wait out a long approval without hitting its timeout.
Who hears about it
An approval request goes out over every transport the organization has configured — mobile push, any Slack or Microsoft Teams channel opted into Pages, and SMS to the Twilio recipient list when credentials are set up. It shares the Pages opt-in rather than having one of its own, because an approval is a workflow asking for a human just as infra.page(...) is, and nobody wants to discover they opted out of one but not the other.
The message carries enough to decide on: what is being approved, the workflow and the run id, whether a person or a schedule started that run, when the request expires, and the fact that no decision counts as a denial. Slack and Teams also get a button straight to the approvals inbox.
SMS is included for the same reason it is included for pages and excluded for drift digests: a blocked production run is a thing that should interrupt someone. It is SMS-only, never a voice call — infra.page rings a phone only when the author asks for voice: true, and an approval has no such knob.
Only the SMS is throttled, at most one text per workflow every 15 minutes. A workflow can call waitForApproval in a loop — once per item in a list, or on every retry — and without a cooldown that is one text message to everybody’s phone per turn of the loop. Push, Slack and Teams stay one message per request: each approval is a separate decision that blocks the run until somebody makes it, so collapsing those would leave requests nobody goes and decides. The first request is never suppressed, a second workflow’s approval has its own cooldown, and the approvals inbox always lists every pending request no matter what was delivered.
Approvals can also be listed and decided over the HTTP API — GET /api/org/{orgId}/workflow-approvals?status=pending and POST /api/org/{orgId}/workflow-approvals/{id}/approve (or /deny) — so a chat-ops bot or an external tool can land the decision. Listing needs workflows:read; deciding needs workflows:approve (see Roles and permissions).
Approvals are org-level records with notifications, so they’re cloud-only: infra.waitForApproval is unavailable in the desktop app’s local workflows, and the generated types mark it as such so you catch it while editing.
The approvals inbox
The card on a workflow’s run view answers “what is this workflow waiting for”. The person doing the approving usually has the opposite question — “what is waiting on me” — so Settings → Approvals lists every pending request across the organization in one place: what is being approved, which workflow and run raised it, when it was requested, when it expires, and Approve / Deny inline.
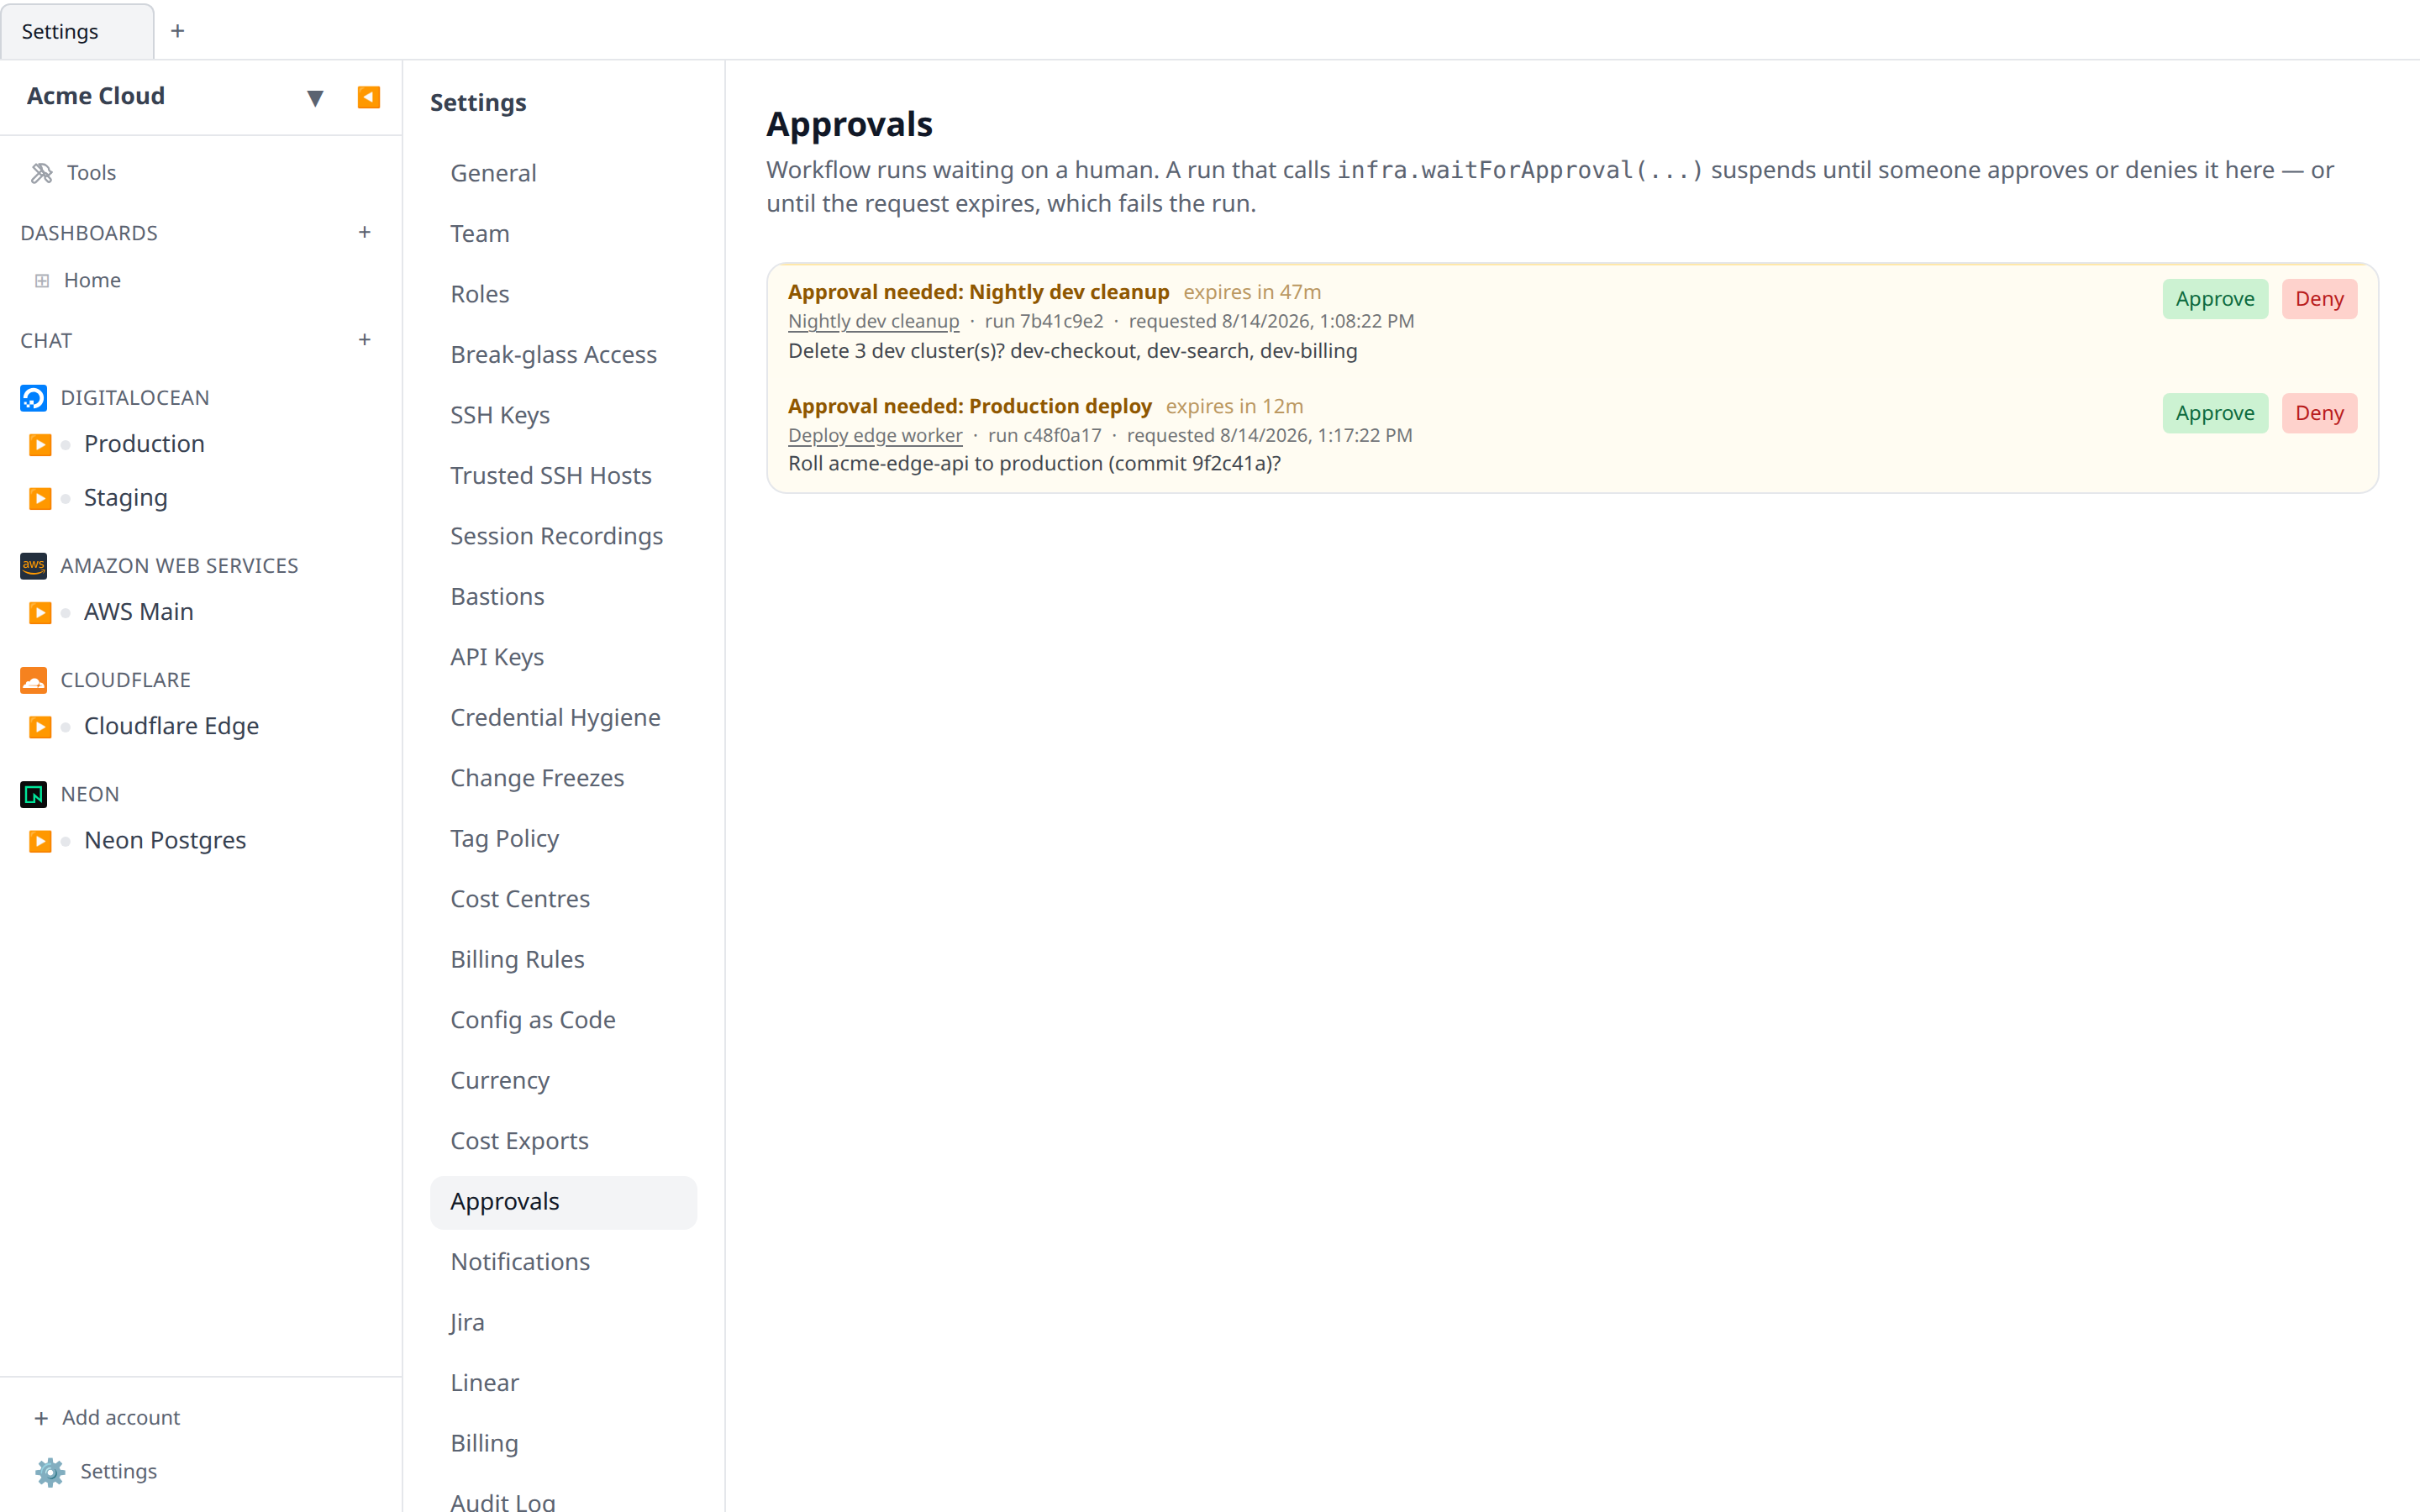
The page is visible to anyone with workflows:read; the Approve and Deny buttons appear only with workflows:approve. It refreshes itself every few seconds, and a request that someone else decides first reports the conflict rather than silently overwriting their decision.
In the desktop app the same inbox appears as a banner above the Workflows tab whenever the selected organization has pending requests, and disappears when it doesn’t.
Deciding from your phone
The mobile app has the same inbox under Settings → Approvals, and tapping an approval push notification opens it with that request pulled to the top and marked as the one you were notified about. Each card carries what the notification carried: the request, the workflow and run it blocks, when it was requested, the countdown to expiry, and the reminder that no decision counts as a denial.
Deciding on a phone takes two taps, never one. Approve and Deny open a confirmation that names the request, the workflow, the run, and the deadline, and spells out what the decision does — approving releases a run against your real infrastructure; denying fails it at that step and cannot be undone. Only the confirmation sends the decision, so nothing lands from a pocket.
Everything else matches the web page: the list is visible with workflows:read, the buttons appear only with workflows:approve, it refreshes on its own and on pull-to-refresh, and a request someone else decided first comes back as “Already decided” with the list refreshed — never as a silent overwrite. If the request your notification was about has already been decided or expired, the screen says so rather than leaving you hunting for it.
Reporting your own cost data
Infrawrench collects spend from every provider that has a billing API, but plenty of money doesn’t come from one — a SaaS invoice, an internal chargeback, a colo bill, a provider with no plugin yet. A workflow can report those numbers itself, and they land in exactly the same place provider-collected spend does: cost graphs, dimension filters, and budgets.
// A nightly cron that pulls yesterday's Snowflake spend and reports it.
const day = new Date(Date.now() - 86_400_000).toISOString().slice(0, 10);
const warehouse = infra.accounts.snowflakeish.getByName("analytics");
const { rows } = await warehouse.query(`SELECT ... WHERE usage_date = '${day}'`);

await infra.costs.write(
  rows.map((r) => ({
    date: day,
    currency: "USD",
    amount: Number(r.credits_used) * 2.5,
    service: String(r.warehouse_name),
    tags: { team: String(r.team) },
  })),
);
Each row needs a date (YYYY-MM-DD, UTC), a 3-letter currency, and an amount. Everything else is optional and becomes a group/filter dimension: service, region, resourceId, tags, plus usageAmount/usageUnit for unit-cost reporting. A negative amount is a credit. You can pass a single row or an array.
Re-running is safe. A row is keyed by its day + service + region + resource + tags + currency, so re-writing the same combination replaces the previous value rather than adding to it. That means a cron can re-report a trailing week every night to pick up late-arriving charges — the same restatement behaviour provider collectors get — without double-counting.
Where it shows up. Workflow-reported rows report Workflow as their provider, and by default appear in the account dimension as “<workflow name> (workflow)”. Pass accountId on a row to attribute it to one of your connected accounts instead (useful for chargebacks or discounts that belong to a real account):
const aws = infra.accounts.aws.getByName("production");
await infra.costs.write({
  date: day,
  currency: "USD",
  amount: -1200,
  service: "Negotiated discount",
  accountId: aws.id,
});
Even then the row stays distinguishable — every workflow-written row carries an infrawrench:workflow tag naming the workflow that wrote it, which is also what guarantees it can never overwrite spend collected from the provider’s own billing API. Because the provider dimension stays “Workflow”, a budget or graph filtered to a specific provider won’t include these rows; filter by account, service, or tag instead.
Limits: 1,000 rows per call (larger arrays are chunked for you) and 50,000 rows per run. Keys beginning infrawrench: are reserved and rejected. Cost storage is cloud-only, so infra.costs is unavailable in the desktop app’s local workflows — the generated types mark it as such so you catch it while editing.
Secrets
Workflow secrets are reusable, encrypted organization values for API tokens, signing keys, and other credentials a workflow needs. Create or rotate them in the workflow editor’s Secrets section, then assign only the secrets that workflow should receive. Values are write-only: after saving, Infrawrench shows Value set but never displays the value again.
Each assigned name becomes a readonly, typed property:
const response = await fetch("https://api.example.com/deploy", {
  method: "POST",
  headers: { authorization: `Bearer ${infra.secrets.DEPLOY_TOKEN}` },
});
Names may be identifiers such as DEPLOY_TOKEN, or dot paths such as stripe.apiKey (used as infra.secrets.stripe.apiKey). The editor autocompletes only the secrets assigned to that workflow. A run takes an encrypted value snapshot at startup, fails before executing if an assigned value is missing, and requires secrets:read from the user the run acts for. Exact assigned values are redacted from persisted workflow logs and output, but workflow source should still never deliberately print or transform credentials.
Secrets are reusable across workflows, while assignment is explicit per workflow. Deleting a secret removes all of its assignments. Organization config exports and generated typings include no secret values.

Metrics
When you create a workflow you can declare metrics in the UI (a key, label, type, and optional unit). Each metric you declare becomes a typed property on infra.metrics, named after its key — read it like a variable and assign to it to persist a new value:
// `runCount` is a declared number metric → typed `number | null`
infra.metrics.runCount = (infra.metrics.runCount ?? 0) + 1;

// a string metric
infra.metrics.lastRegion = "us-east";
Reads come from a snapshot taken when the run starts, so they’re synchronous (no await). Assignments are saved automatically when the run finishes — even if it later errors, so partial progress is kept. Metric values persist between runs: a nightly cron can increment a counter, and a manual run sees the latest value. The editor autocompletes infra.metrics. with exactly the keys you declared, each typed to its declared type.

Where your workflows live
A workflow belongs either to your machine or to an organization, and the desktop app follows the org switcher to decide which set it shows — the same way accounts, dashboards, and costs do.
- Local mode — workflows are stored in the desktop app’s local database and run in an isolate on your machine, against the accounts you’ve added locally. Nobody else sees them.
- An organization selected — the Workflows tab shows that organization’s workflows, shared with your teammates and identical to what the web app shows. They run on the cloud host, against the org’s accounts.
Switching orgs swaps the list; nothing is copied between the two. A workflow written locally stays local until you recreate it in the org (copy the source across — the infra object is the same shape on both sides, as long as the org has accounts for the providers it names).
Two things follow from where a workflow lives. Its capabilities differ slightly: local workflows have no cost store, so infra.costs is unavailable; infra.ai and infra.waitForApproval are cloud-only too; and infra.page becomes a native OS notification instead of fanning out to SMS, push, Slack, and Teams. And its automated triggers differ — see the trigger table below.
Pinning a workflow to a dashboard
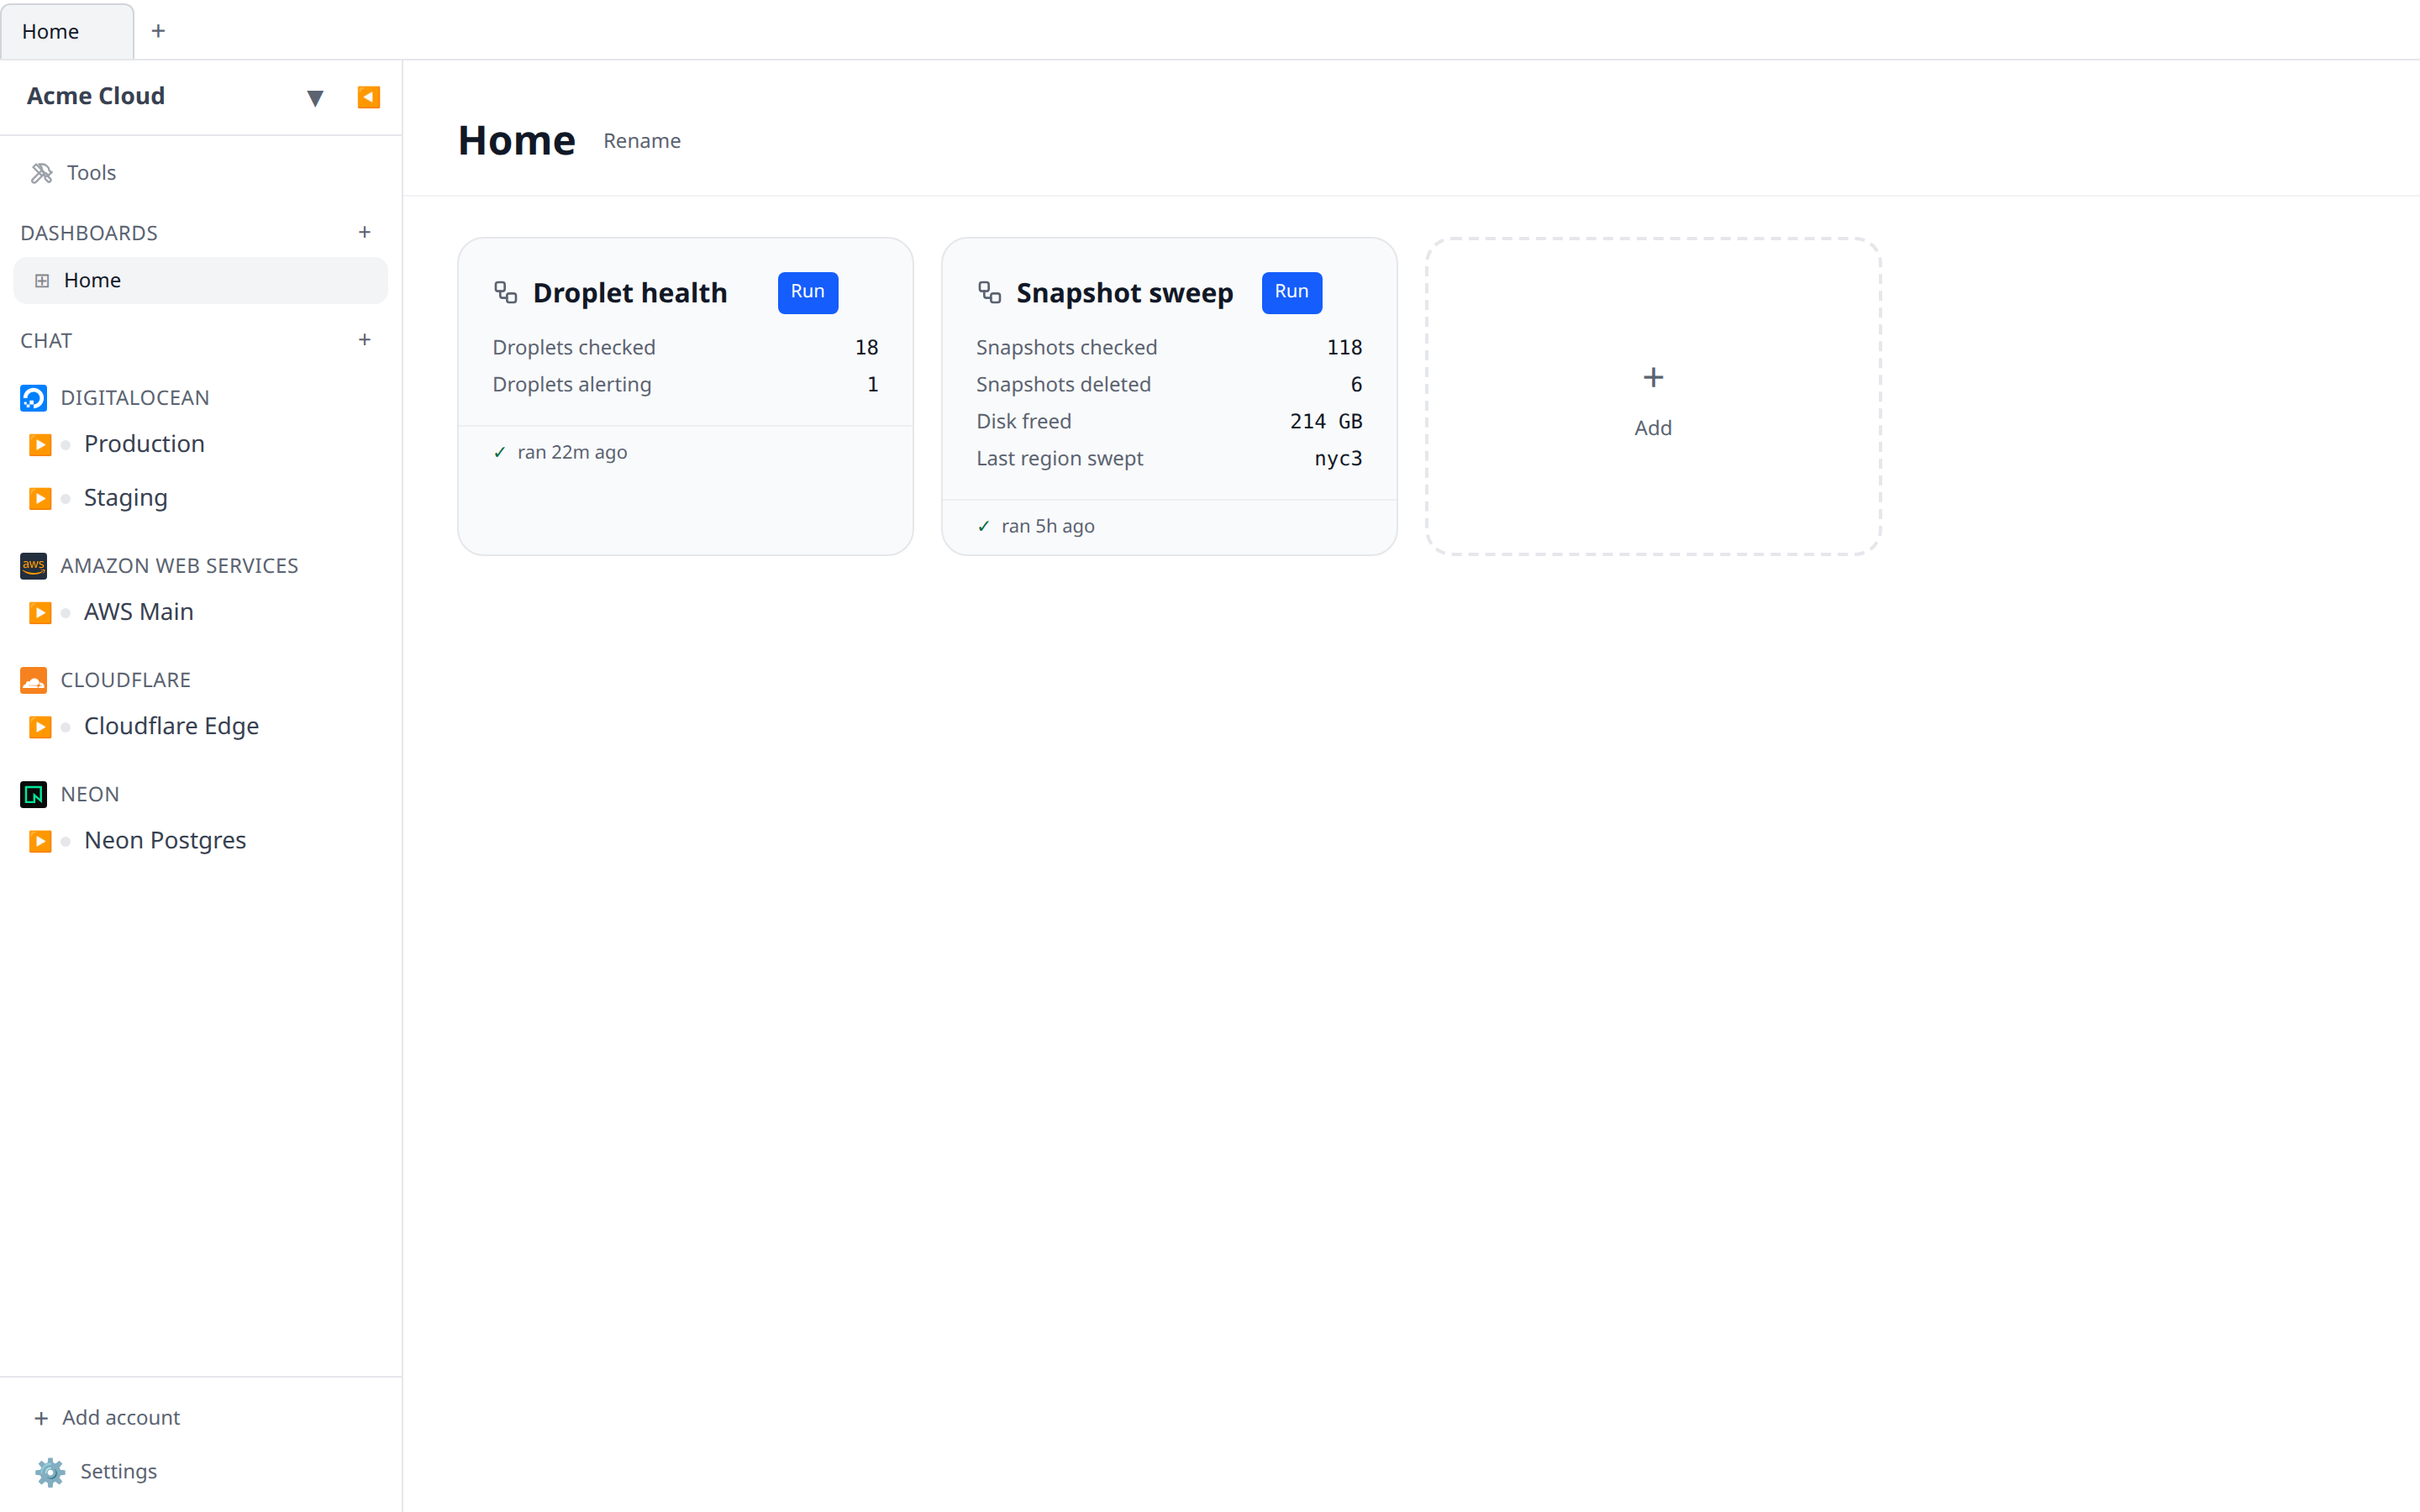
Drag a workflow from the list on the left of the Workflows tab onto any dashboard (or onto a dashboard in the sidebar) to pin it. Use the search box above the list to filter by name when you have a lot of workflows. The workflow shows up as a card listing its declared metrics with their current values, when it last ran, and a Run button that triggers it and refreshes the values in place — so a dashboard can double as a live readout of whatever your workflows track.
A pin never crosses the local/cloud boundary: in Local mode you pin local workflows onto local dashboards, and with an organization selected you pin the org’s workflows onto the org’s dashboards. Because the two lists follow the same switch, whichever workflows you can see are the ones you can pin.
Triggers
Open the trigger settings to choose how a workflow runs:
- Manual — run on demand from the UI. The only mode that allows
infra.prompt. Available everywhere (desktop, web, proxy). - Cron — run on a schedule. Pick a preset (every 15 minutes, daily at 9am, weekly…) or type a raw 5-field cron expression; see Cron schedules below.
- Git — run on each new commit to a branch. Connect GitHub, choose a repository from the picker, and set the branch — the Infrawrench GitHub App watches that repo as a bot and runs the workflow when the branch head changes. Needs an organization: a local workflow has no always-on host to watch a repo.
- Budget — run when a cost budget crosses a threshold. Pick a budget, a percentage of its monthly amount, and whether to compare spend so far or the forecast month-end total. Needs an organization (budgets are a cloud feature).
Which triggers you can pick depends on where the workflow lives, not on which app you’re using — a desktop app with an org selected offers the same four triggers the web app does:
| Trigger | Desktop (local) | Desktop (org) | Web | Web proxy |
|---|---|---|---|---|
| Manual | ✅ | ✅ | ✅ | ✅ |
| Cron | ✅ (while open*) | ✅ | ✅ | ✅ |
| Git | — | ✅ | ✅ | ✅ |
| Budget | — | ✅ | ✅ | ✅ |
Organization workflows run their cron and git triggers on an always-on cloud host, whichever app created them. Local workflows are run by the desktop app itself: while at least one local cron workflow is enabled, Infrawrench keeps running in the background after you close the window (just like active metric-ping alerts) so the schedule keeps firing. *It can’t fire while the app is fully quit — quit it and the local schedule pauses until you reopen. For schedules that must run 24/7 regardless, put the workflow in an organization or use the web proxy.
Cron schedules
The cron trigger takes a standard 5-field expression (minute, hour, day of month, month, day of week) supporting *, lists (1,15), ranges (9-17), steps (*/5, 9-17/2), and 3-letter month/weekday names (JAN, MON); 7 works as Sunday. When both day fields are restricted, a date matches if either does — 0 0 13 * 5 is “the 13th, or any Friday”, the classic cron behaviour.
Next to the expression is an optional timezone field taking an IANA name like Europe/London. Leave it empty for UTC. Wall times are evaluated in that zone, so 0 9 * * * in America/New_York keeps firing at 9am local across daylight-saving changes; a wall time skipped by spring-forward simply doesn’t fire that day, and during fall-back’s repeated hour the schedule fires once, at the first occurrence.
As you type, the editor validates the expression (a typo shows the parse error instead of saving something that would never fire), summarises it in plain English, and previews the next few run times — computed by exactly the same code the scheduler uses, so what you see is what will run. Saving never fires the workflow immediately: the first run happens at the schedule’s next occurrence. The enable toggle on the workflow pauses the schedule without losing it, and each schedule fires exactly once per occurrence no matter how many scheduler replicas are running.

A workflow’s schedule is also a small API surface of its own — GET/PUT/DELETE /api/org/{orgId}/workflows/{id}/schedule — so an SDK or script can manage when a workflow runs (or pause it) without round-tripping the whole workflow. See the API docs.
Connecting GitHub
Git triggers use a GitHub App (a bot identity) rather than per-repo webhooks. In the git trigger settings, click Connect GitHub — you’ll install the app on the repositories you want to watch in a new tab, and when the install finishes that tab returns to Infrawrench with a confirmation and the repositories appear in the repo picker. If you’re a member (not an owner) of the GitHub organization, GitHub only lets you request the install — Infrawrench will tell you the install is awaiting an owner’s approval, and the repos show up once an owner approves it on GitHub. A separate github-watcher service polls each watched repo’s branch head and runs the workflow on a new commit. Self-hosters configure the app with GITHUB_APP_ID, GITHUB_APP_PRIVATE_KEY (PEM), and GITHUB_APP_SLUG, and point the app’s setup URL at /api/github/setup.

Budget triggers
A budget trigger reads: when budget A goes over X%, run this workflow. Choose the budget, the percentage of its monthly amount, and which number to compare:
- spend so far — month-to-date actual spend. Fires once the money is genuinely gone.
- forecast spend — the projected month-end total. Fires earlier, while you can still do something about it.
Leave the percentage at 100 for a plain “went over budget”. Set it lower (say 80) to act before the limit, or above 100 to catch a serious overrun.
The crossing is evaluated on the server right after each cost collection, so a budget trigger needs no schedule of its own. It fires at most once per calendar month per budget — a workflow that shuts down a runaway cluster won’t re-run every 15 minutes for the rest of the month. Editing the budget, percentage, or measure re-arms it immediately. Budget alerts (SMS/push) are configured separately on the budget itself; a workflow trigger doesn’t require any alert thresholds on the budget.
The workflow receives the crossing as infra.event, typed for you when the trigger is set to Budget:
// infra.event is the budget crossing that started this run.
await infra.log(
  `${infra.event.budgetName} hit ${infra.event.percent}% ` +
    `(${infra.event.observedCents / 100} ${infra.event.currency} of ` +
    `${infra.event.amountCents / 100}) in ${infra.event.month}`,
);

// Scale the dev cluster down to nothing for the rest of the month.
const gcp = infra.accounts.gcp.getByName("production");
for (const cluster of await gcp.gkeClusters.list()) {
  if (cluster.name.startsWith("dev-")) await cluster.delete();
}

await infra.output({ budget: infra.event.budgetId, actedAt: infra.event.month });
For every other trigger infra.event is just { kind: "manual" | "cron" | "git" | "api" }, so a workflow can branch on how it was started.

Signing webhook deliveries
Workflows with a git trigger also expose a plain webhook endpoint, matched by an opaque token in the URL, for providers other than the GitHub App path above. A URL is a weak secret — it ends up in access logs, proxy logs, and referrer headers — so set a signing secret in the git trigger settings whenever you use it.
With a secret set, a delivery must prove it knows the secret or it’s rejected with a 401:
- GitHub and compatible senders:
X-Hub-Signature-256: sha256=<hex>, an HMAC-SHA256 of the exact request body. GitHub’s older SHA-1X-Hub-Signatureis not accepted — honoring it would let a sender pick the weaker digest. - GitLab:
X-Gitlab-Tokenmatching the secret directly.
Paste the same value into your provider’s webhook configuration. The secret is write-only: after saving, the trigger shows Signed ✓ and you can replace it, but the value is never displayed again. Leave it empty and the endpoint accepts unsigned deliveries on the strength of the token alone.

Writing workflows with an AI client
The AI chat and MCP surfaces can author workflows for you — “make a workflow that shuts down the dev cluster when my Production budget goes over 90%” is a single request. Both use the same tools:
| Tool | What it does |
|---|---|
list_workflows | The org’s workflows with their triggers, metrics, and last/next run. |
get_workflow | One workflow, including its source, current metric values, and recent runs. |
get_workflow_typings | The generated infra.d.ts — your real accounts, resource types, and SSH key names. Default is the fast static surface; pass enrich:true for precise create() field unions. |
check_workflow_source | Type-checks a draft without saving it. |
write_workflow | Creates or updates a workflow. Type-checks first and refuses to save source with type errors. |
run_workflow | Runs it now and returns the status, logs, output, and any error. |
delete_workflow | Soft-deletes it (run history is kept). |
list_workflow_secrets | Lists reusable workflow secret ids, names, and whether each has a value — never the values. |
write_workflow_secret | Opens a secure password prompt in Infrawrench chat; MCP can create or update metadata but cannot carry plaintext. |
delete_workflow_secret | Deletes an encrypted secret and removes its workflow assignments. |
Asking for a recurring check is a single request too — “check my Kubernetes clusters’ pods every hour and page me if any restart count goes above 5” builds the cron workflow above, infra.page and all. The typings tell the model that paging exists and that it is throttled per key, so it writes the check to page unconditionally rather than inventing its own bookkeeping.
get_workflow_typings is the important one. The infra API is generated per organization — account names, which resource groups exist, which peers a cluster or database exposes — so a model that writes from memory guesses wrong. Handing it the real declaration file first is what makes the generated code compile against your setup. It also reflects the trigger: a budget-triggered workflow gets infra.event typed as the crossing payload, and only manual workflows get infra.prompt. The default response is the fast static surface (create fields are Record<string, string>); pass enrich:true only when you need precise create() field unions from live provider configs — that hits provider APIs and can be slow. The same split is on the HTTP route: GET /api/org/{orgId}/workflows/{id}/typings is static, and ?enrich=1 is the upgrade pass the editor runs in the background.
The tool also keeps the model’s context small: an organization with many connected plugins can have a very large infra.d.ts, so instead of returning the whole file the tool sends the global scope (the infra object and everything it references by name) plus an index of the named per-plugin interfaces, and the model fetches just the ones it needs — typeNames: ["aws"] pulls every AWS interface, or individual names like Account_aws can be requested as they are encountered. Small organizations still get the whole file in one call, and scope: "full" always returns everything.
The typings are the whole truth about infra: what isn’t declared there doesn’t exist at run time either. That makes check_workflow_source the right way to test a guess. Probing by saving a draft and running it is slower and can mislead — reading a property that doesn’t exist yields undefined rather than throwing, so a run that quietly did nothing looks like a run that succeeded.
write_workflow then runs the same type check the editor runs and returns the diagnostics (line:column, TypeScript error code, message) instead of saving a broken workflow — so the model can fix its own mistakes before anything is persisted. Pass skipTypecheck to override that deliberately.
Workflow tools need the same workflows:read / workflows:write permissions as the Workflows tab, and write_workflow, run_workflow, and delete_workflow are all audit-logged. run_workflow and delete_workflow are destructive tools — in chat they wait for your approval before running. Running a workflow executes arbitrary code that can create or delete infrastructure, which is why it needs the same confirmation as deleting one.
A workflow’s code runs with your account credentials. Read the source of anything you didn’t write before you enable it or hand it to run_workflow.
What a run is allowed to do
workflows:write lets you start a run. It does not decide what the run may do once it starts.
Every operation the sandbox performs is checked against the permissions of the user the run acts for, using the same permission strings as the rest of the product — so a workflow is not a way around a role:
| Operation | Needs |
|---|---|
| Listing, reading, describing, logs, metrics, manifests | resources:read |
Reading a resource output (resolveOutput) | secrets:read |
Reading assigned infra.secrets values | secrets:read |
create(), update(), applying a manifest, importing YAML | resources:write |
delete() | resources:delete |
.ssh(), .query(), the KV helpers, NoSQL | resources:execute |
| Object and SFTP reads | storage:read |
| Object and SFTP writes | storage:write |
infra.costs.write | costs:write |
Reading a resource output needs secrets:read rather than resources:read because an output can be a connection string or a generated password — the same rule the get_resource_outputs tool follows.
Logging, infra.output, metrics, infra.fetch, infra.ai, paging and approvals need no permission: they touch nothing outside the run — an AI call’s spend is bounded by the org’s monthly AI cap, which is billing policy rather than a role.
Who a run acts for depends on how it started:
| Trigger | Acts for |
|---|---|
| Run button, debugger, HTTP, AI chat | Whoever started it |
| Cron schedule | The workflow’s author |
| Git push | The workflow’s author |
| Budget threshold crossing | The workflow’s author |
Scheduling a workflow therefore cannot give it authority its author lacks, and a workflow whose author has left the organization stops being able to do anything privileged — its next run fails on the first such call rather than continuing to act with a departed colleague’s access. If you inherit a workflow like that, re-save it under your own account or ask an owner to.
A refused operation throws inside the workflow and names the permission it needed, so you can catch it like any other error — or read it off the failed run and ask an admin for the right role.
The isolate sandbox
Workflow code never runs in the host process. It executes in a QuickJS WebAssembly isolate with a hard memory limit and a wall-clock timeout, and with no ambient access to the filesystem or to sockets — the only capabilities a workflow has are the ones infra grants it and the fetch described above, all of which are performed by the host (with your account credentials, never exposed to the script). The same isolate runs identically on desktop and on the server, so a workflow behaves the same wherever it runs — with the one documented exception that a cloud fetch leaves through a proxy and can only reach the public internet.
Debugging
A manual run from the editor is a debug run: as it executes, the editor highlights the line currently running, so you can watch a workflow step through create → waitUntilReachable → ssh → delete in real time.
Breakpoints. Click the gutter (left margin) next to a line to set a breakpoint (a red dot). When the run reaches that line it pauses before executing it, and the toolbar shows:
- Resume — continue until the next breakpoint.
- Step — run the current line, then pause on the next one.
- Stop — abort the run.
You can add or remove breakpoints while a run is paused. Time spent paused at a breakpoint (and infra.prompt, SSH, and waitUntilReachable waits) doesn’t count against the run’s execution budget.
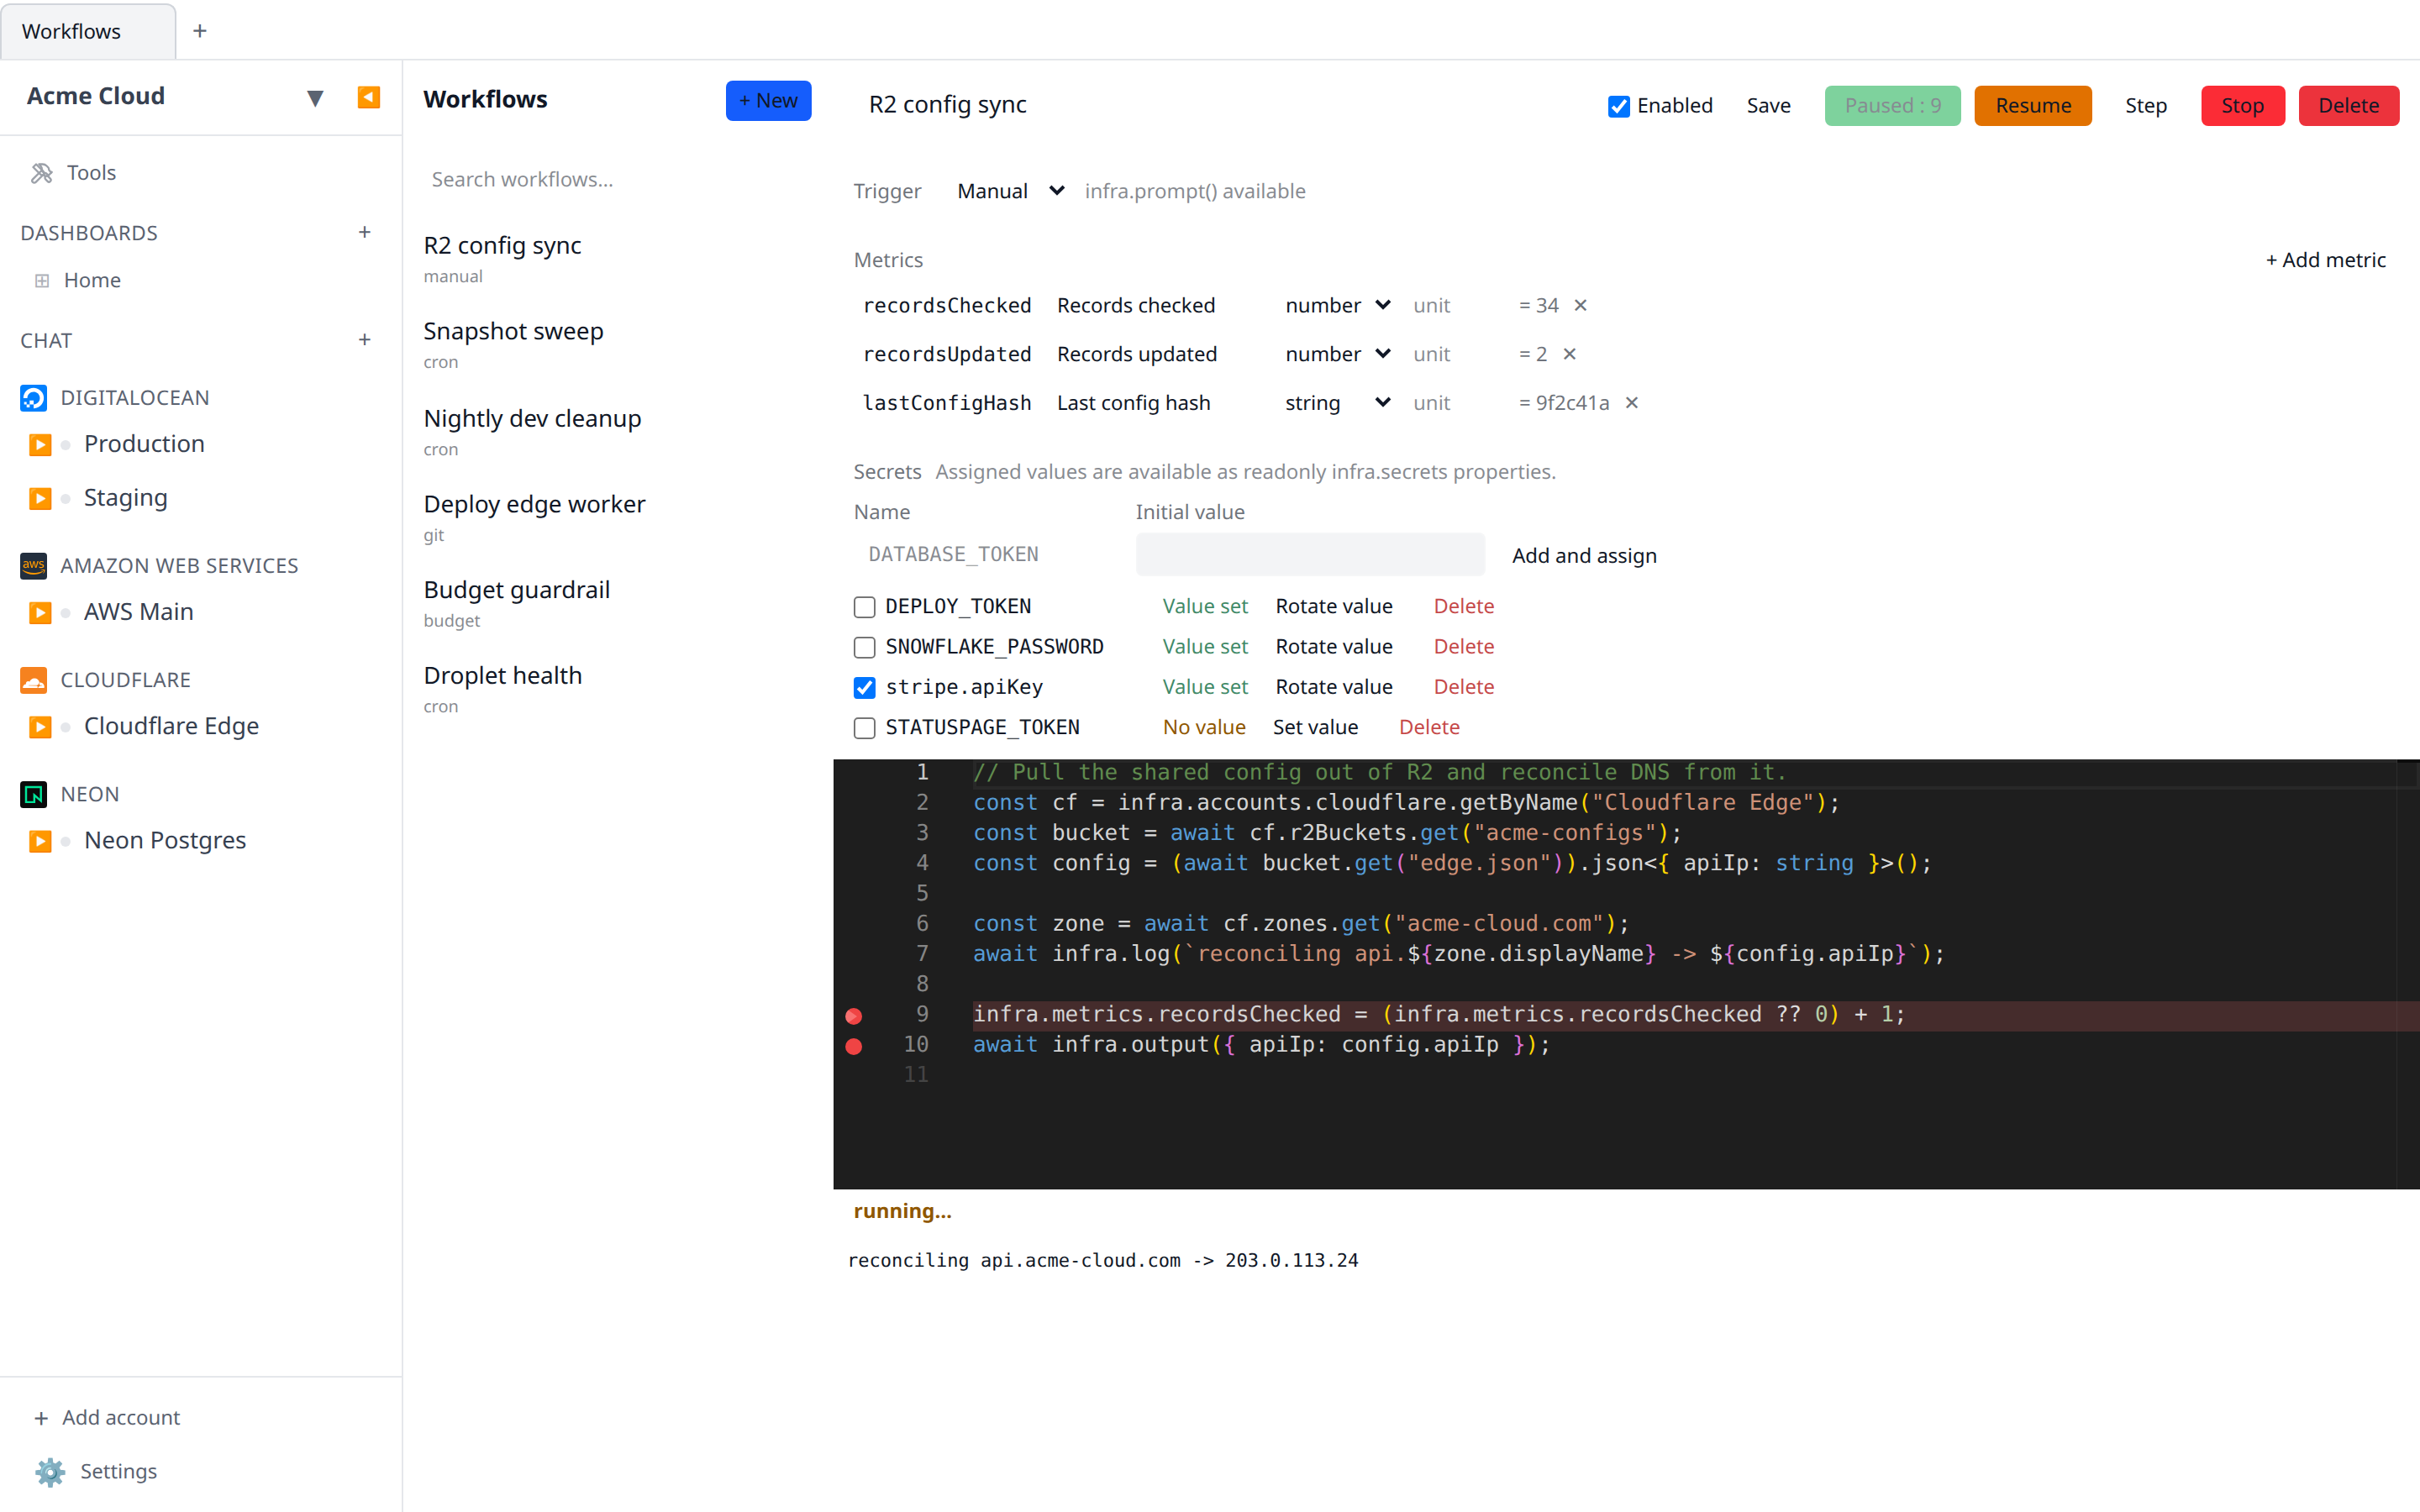
Debugging works on both the desktop app and the web app (the web run streams over a websocket). Highlighting reports each line as it runs, so very tight loops execute a bit slower while the editor is driving them; automated cron/git runs are never instrumented. Breakpoints only stop on top-level statements — lines inside a function/callback aren’t paused individually.
Runs
Each execution records a run with its status, streamed logs, declared output, timings, and any error. The Run history section at the bottom of the workflow’s page lists them newest first, so you can see what a cron has been doing without going near the API.
Every row shows the run’s status (success, failure, running, pending, canceled), when it started, how long it took, and what started it — Manual, Schedule, Git push, API, or Budget. Logs on a row expands it in place to that run’s log lines (coloured by level), its error if it failed, and its declared output. Nothing is fetched to expand a row: the logs arrive with the history.
A run that is still going shows in progress instead of a duration. The run you just started from the editor isn’t listed twice — its row is marked streaming above while the live log panel is following it, and shown above once the result panel has it.
The header counts the runs, and the list shows the ten most recent with a Show N more button for the rest. The history holds the latest 50 runs — that is what the API returns and there is no paging, so older runs age out of the view.
The same history is on the mobile app’s workflow screen (tap a run to expand its logs), and GET /api/org/:orgId/workflows/:id/runs returns the same rows if you’d rather read them from a script.