Scenario models
Overlay known future cost — a purchase, a new team, a migration — onto a forecast, without ever touching the trend or your recorded spend.
A forecast is a trend. It is a least-squares fit over your trailing daily totals, and it can only ever extrapolate what already happened: it cannot anticipate a purchase nobody has made yet, a reserved-instance charge landing next quarter, a team that starts in September, or a tier change that takes a fifth off the run rate the day it ships.
A scenario model is the other half. It is known future cost — the things somebody in your organization already knows are coming — written down once and overlaid on the projection.
The two answer different questions and are never merged into one number:
| Answers | |
|---|---|
| Trend forecast | “If nothing changes, what does this cost?” |
| Scenario model | “Here is what we already know is changing.” |
Apply a scenario and the chart draws both lines. The trend stays exactly where it was, and the adjusted line sits beside it under the model’s name. A projection that silently folds in somebody’s assumptions is worse than no projection at all, so every surface that draws one says which model is applied and what it added.
What a model contains
A model is a name, one currency, and a list of adjustments. Each adjustment is one of three kinds:
| Kind | What it says | Example |
|---|---|---|
| One-off amount | A single charge on a single day | An annual licence renewal on 12 September; a three-year reservation bought up front |
| Recurring amount | The same amount every day or month from a date, optionally ending | A new team’s fixed $8,000/month from October; a pilot that stops in November |
| Step change in rate | ±X% of the trend from a date, optionally ending | A migration that takes 20% off compute; a pricing tier that adds 8% |
Amounts can be negative. “We are turning off the old cluster in November” is as real a piece of known future cost as buying something new, and a model that could only add would be half a tool.
Scope
Every adjustment can carry a scope — the same filter vocabulary as everything else in cost graphs (provider, account, service, region, resource, tag, charge type, commitment). An empty scope means the whole organization.
Scope means slightly different things for the two families, and the difference is deliberate:
- For a step change in rate, the scope is what the percentage is of.
−20%scoped toprovider = 'aws'takes a fifth off the AWS trend and leaves everything else alone. Infrawrench fits a separate trend for that slice and applies the percentage to it, so the adjustment can never move spend it does not describe. - For an amount, the scope decides whether the adjustment belongs on a given chart at all. A $40,000 GCP commitment has no business on a chart filtered to AWS. When a chart’s own filters exclude an adjustment’s scope, the amount is left out — and the card says so by name, so you never have to wonder whether it was quietly counted.
One currency per model
Every amount in a model must be in the model’s currency. A model that held both EUR and USD amounts would produce a projection that is the sum of two different kinds of money, so it is refused at the point you save it rather than converted behind your back at a rate you may not have stated.
If the chart you apply the model to is denominated in a different currency, Infrawrench converts the amounts using your organization’s own stated exchange rates and says so on the card. If no rate exists for that pair, applying the model is an error rather than a silently wrong line. Percentages are currency-free — a percentage of the trend is denominated in whatever the trend is — so a model of pure rate changes applies anywhere.
The rules
Three things are true of every scenario, everywhere it is drawn.
A scenario never alters recorded history. Adjustments are evaluated only on days after the last day with collected spend. An adjustment dated in the past is not an error — a recurring cost that started in June is a perfectly sensible thing to describe — it simply contributes nothing to days that already have real money behind them. Your actuals are what your providers billed, always.
The trend stays visible. The unadjusted forecast and the adjusted projection are returned and drawn together. You can always see what the fit said before anybody’s assumptions touched it.
Applying a scenario is explicit and labelled. The chart names the model in its legend, in its tooltip, and in a caption under the title that also states how much the scenario added over the horizon. On mobile the same caption appears on the card. The infrawrench CLI prints the trend total above the adjusted one, every time.
How overlapping adjustments compose
Adjustments compose in a fixed order, and the order is part of the contract rather than an accident of implementation.
For each projected day:
- Step changes in rate apply first, each measured against the unadjusted trend of its own scope.
- Amounts are added afterwards, on top of the re-rated trend.
- The result is clamped at zero, exactly as the trend forecast is — a projection cannot be negative spend.
Two consequences worth knowing:
- Rates never discount your amounts. “We are migrating, so everything gets 20% cheaper” is a statement about the running cost; it is not a discount on the annual licence you also told us about. A $50,000 purchase alongside a −20% rate change shows as $50,000, not $40,000.
- Overlapping rate changes compose additively, and their order cannot matter. Because each one reads the same untouched trend,
+10%and−20%together is−10%(not×1.1 × 0.8). Two people adding rate changes to the same model in either order get the same projection.
A worked example, on a chart trending at $100/day, with a −50% rate change and a $1,000 one-off both starting on the same day:
day 1:  100 × 0.5  +  1,000  =  1,050
day 2:  100 × 0.5           =     50
Budgets
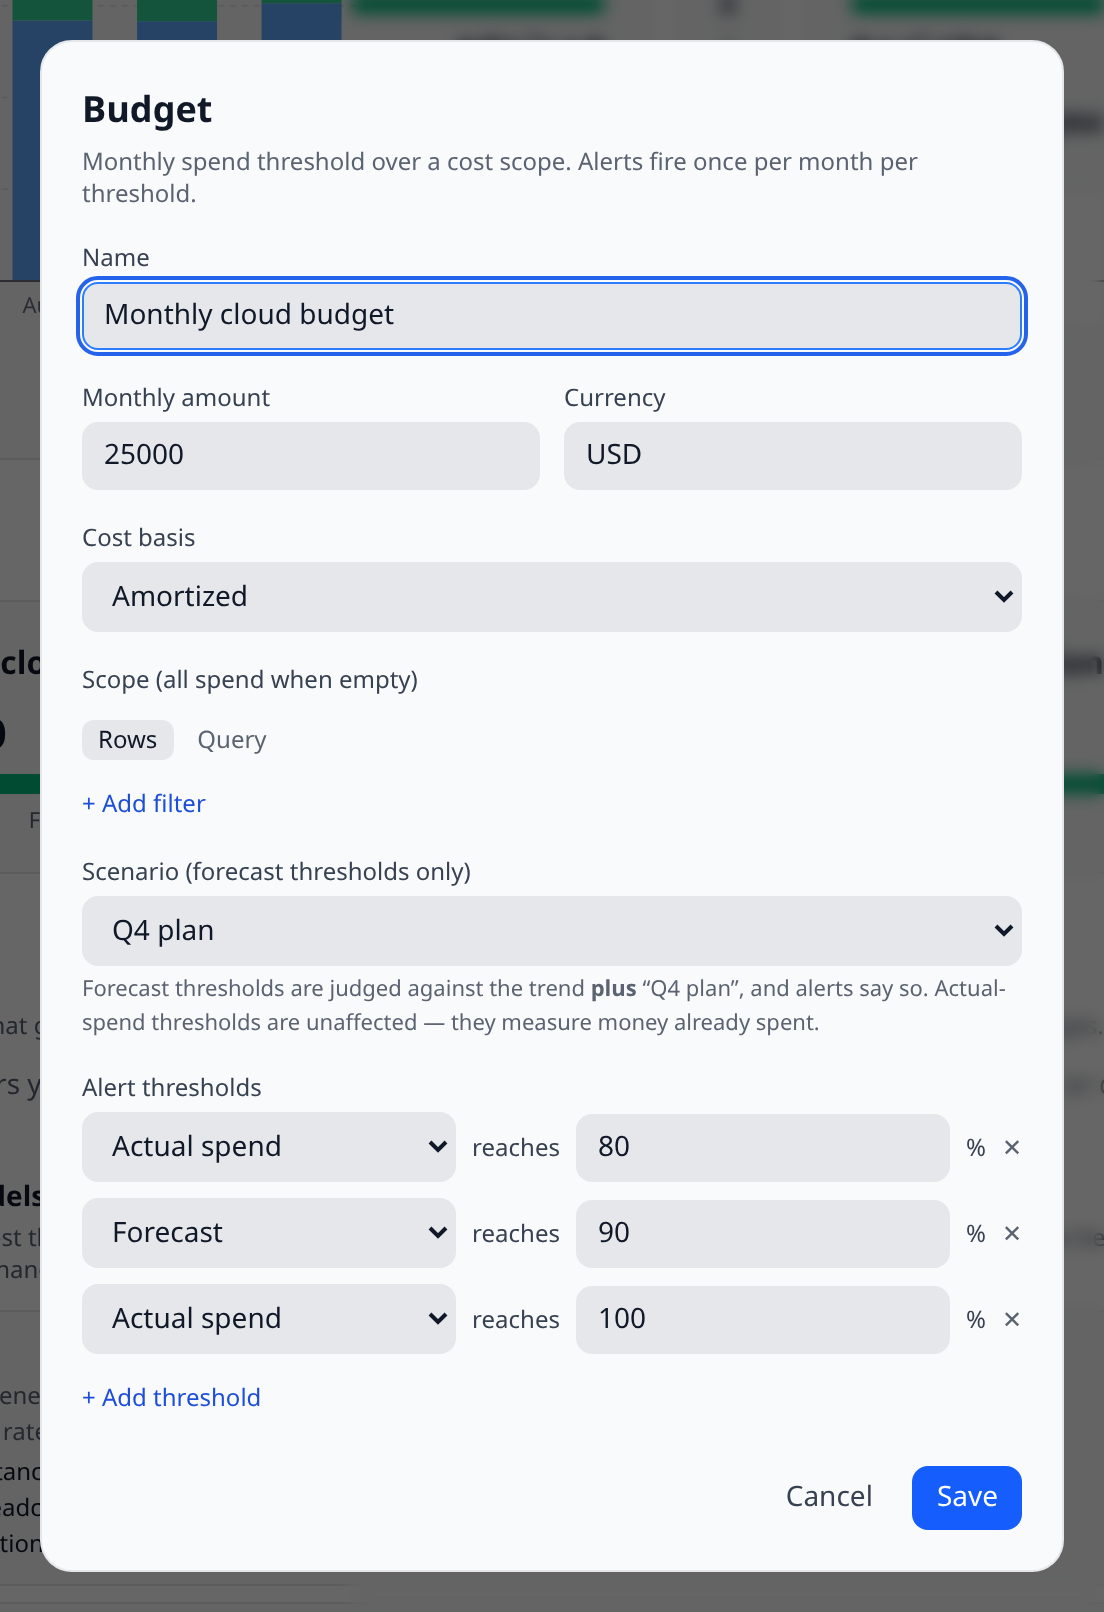
Budgets keep using the unadjusted trend unless a budget explicitly opts into a model. This is the sharpest decision in the feature and it is deliberate.
A scenario is a hypothesis somebody typed into a form. A budget’s forecast threshold decides when a real person gets paged. If every scenario silently fed every budget, anyone with costs:write could change an on-call rota by editing an object two screens away — and the resulting page, or the missing page, would carry no evidence of why.
So the opt-in is per budget, and when it is on:
- The budget’s forecast thresholds are judged against the scenario-adjusted month total.
- The unadjusted trend forecast is still reported alongside it, so the budget card shows both numbers and you can see what the model moved.
- The alert body names the model — a threshold crossed on an adjusted number reads
… (includes scenario "Q4 plan"), so “why was I paged” is answerable from the message itself. actualthresholds are never affected. They measure money already spent, which no scenario can touch.
A budget that opted into a model that is later deleted is not silently reverted to the trend — deleting a referenced model is refused (see below).
Creating and editing
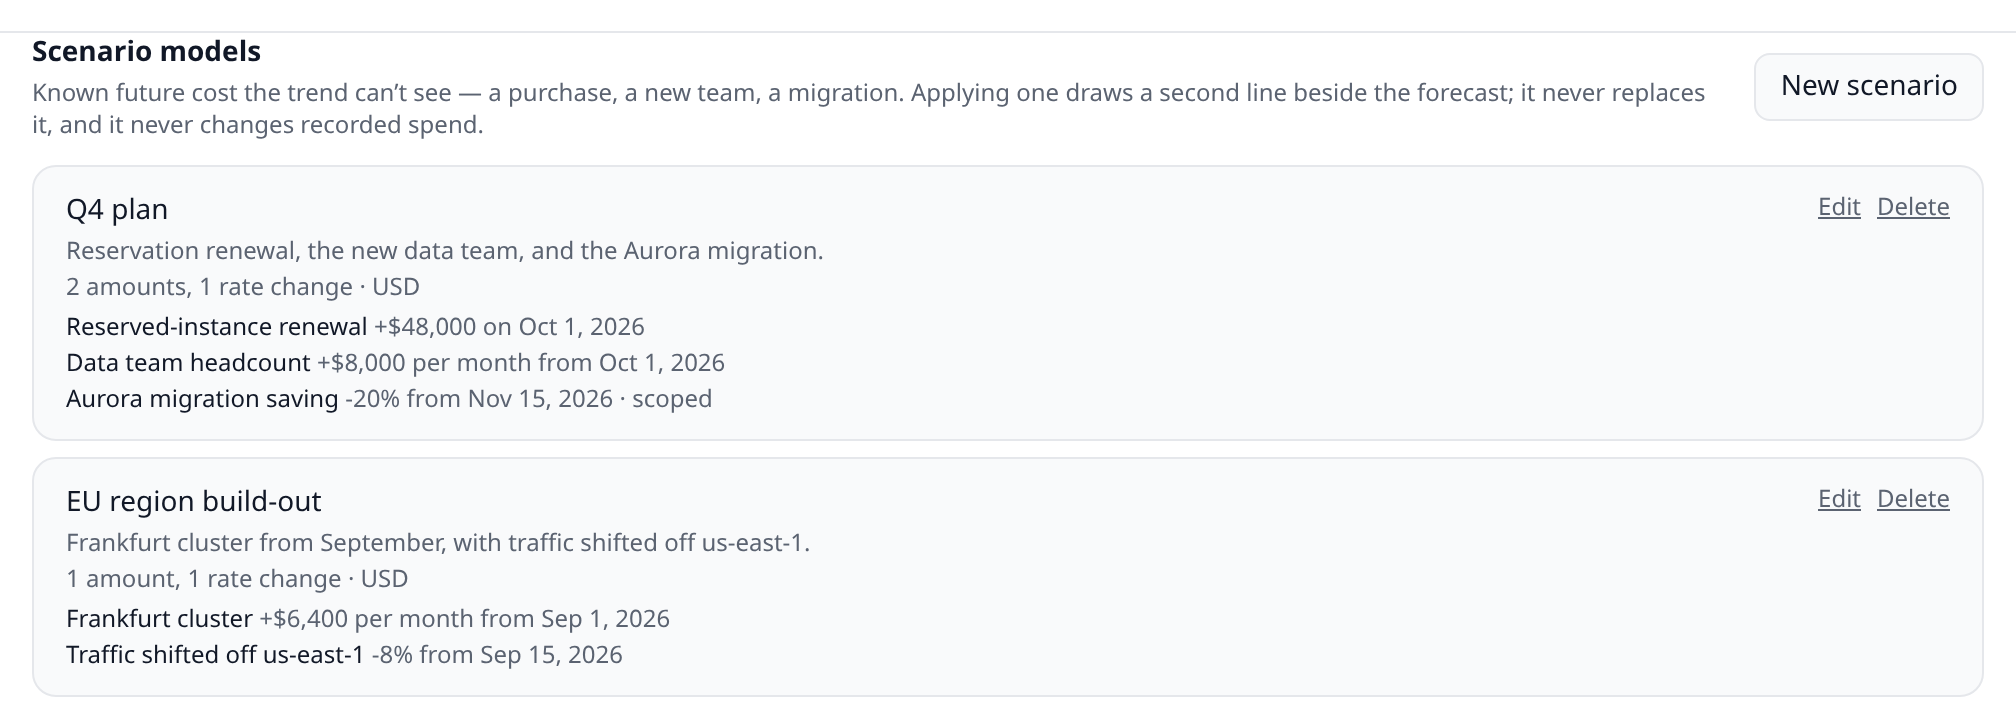
Scenario models live on the Costs panel, under Scenario models — next to saved filters, and for the same reason: a scenario is a cost object, not a preference. Settings is where you configure Infrawrench; the Costs panel is where you describe your own spend. It also puts models within sight of Budgets, which is where a model’s sharpest consequence lives.
Creating and editing needs costs:write; reading needs costs:read.
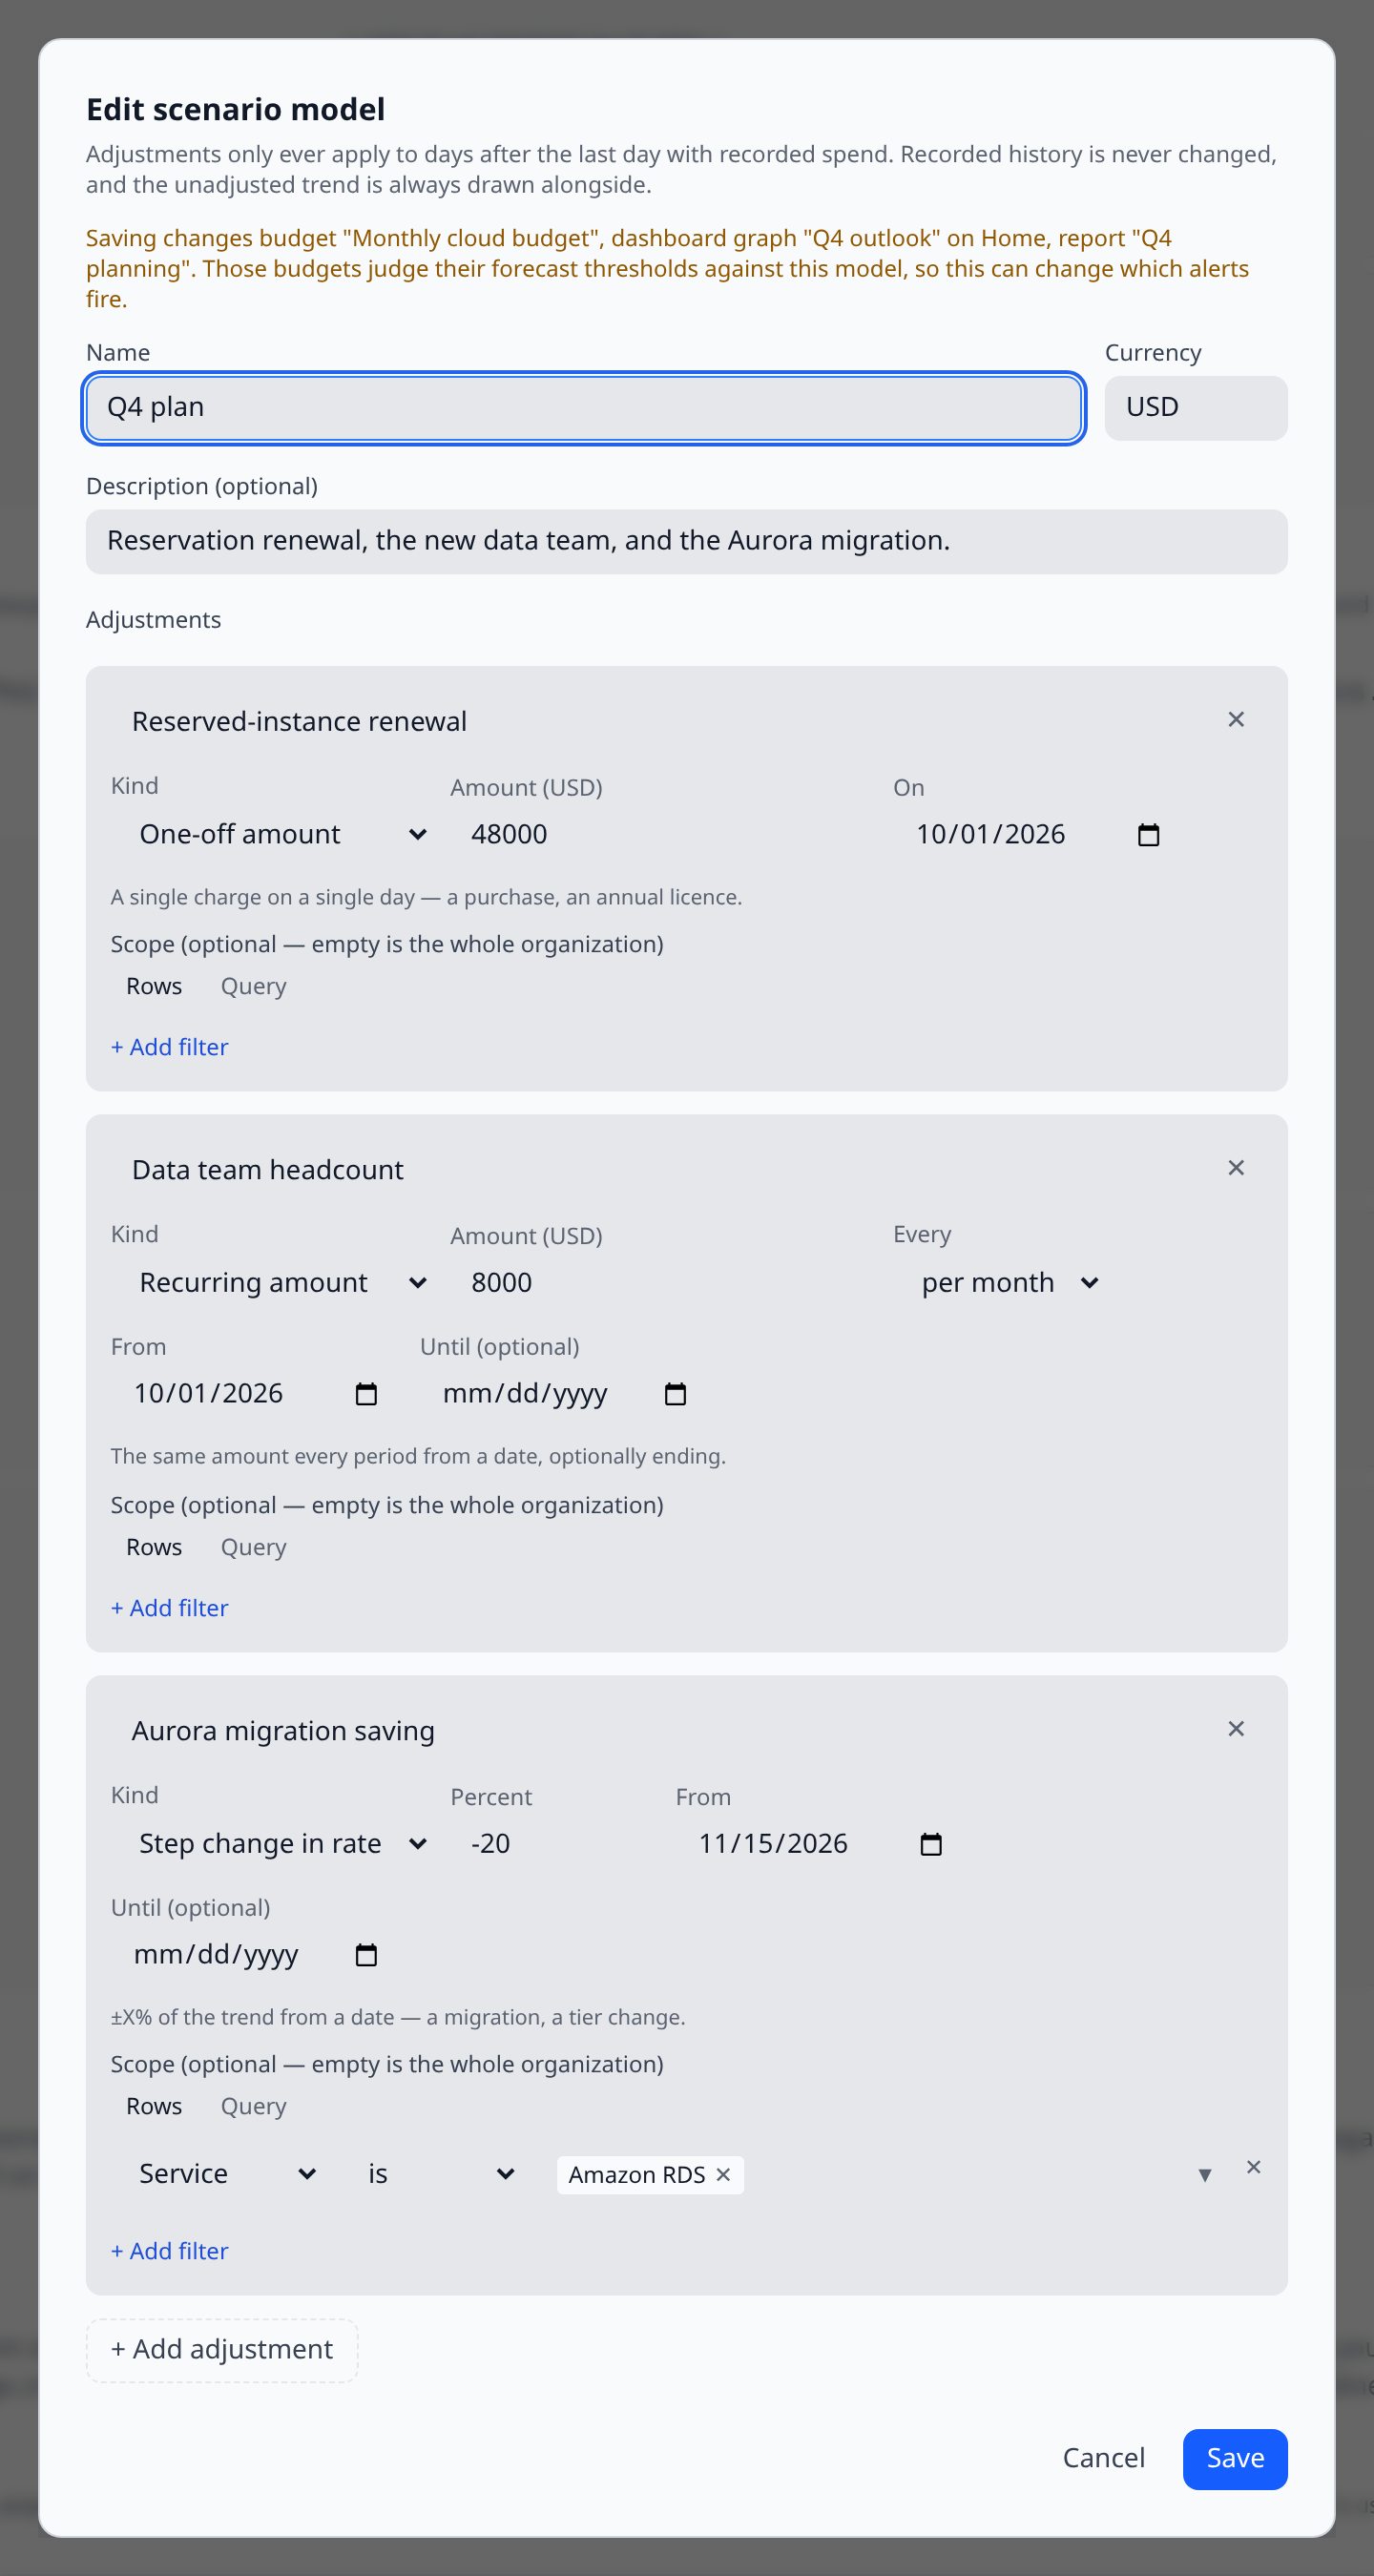
Because charts, reports and budgets reference a model by id, editing one changes every projection built on it. The editor names the referents before you save, and calls out budgets specifically:
Deleting a model that is still referenced is refused, with the referents listed. For a chart, deleting would silently drop the assumptions from a projection somebody is reading. For a budget it would move the forecast thresholds back to the bare trend, changing when people get paged. Detaching is a deliberate step, never a side effect of a delete.
Applying one to a graph
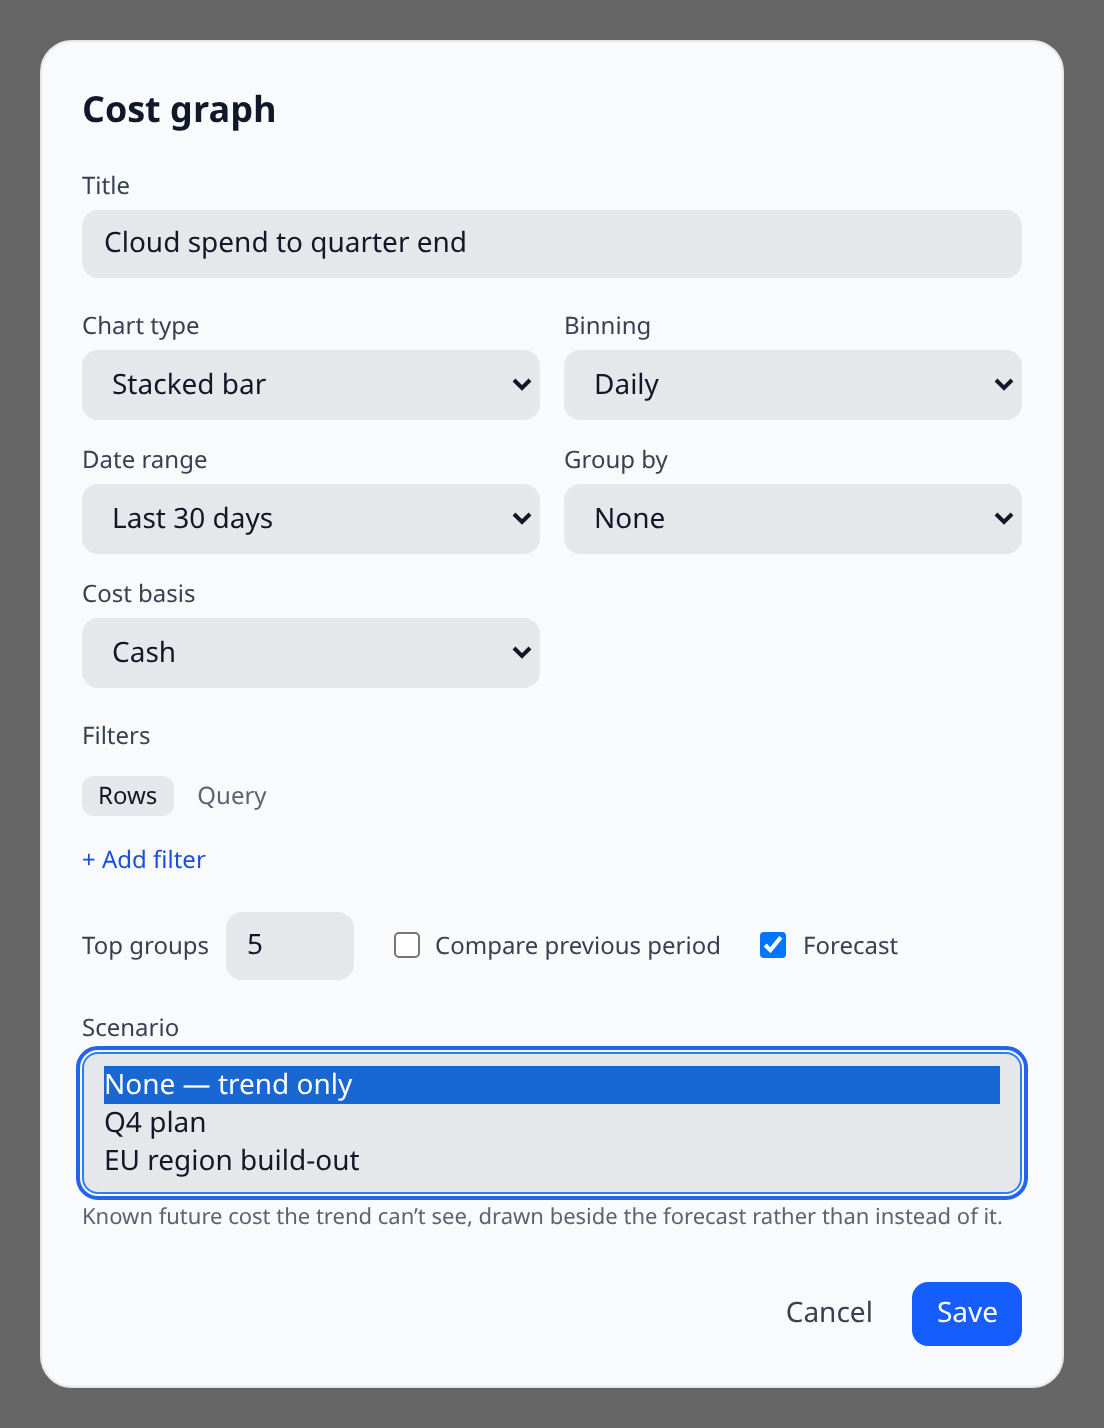
Open any cost graph’s editor, turn on Forecast, and pick a model from Scenario. The picker only appears when your organization has at least one model, and it is disabled while the forecast is off — a scenario adjusts a projection, so there is nothing to adjust without one.
The selection is stored on the graph’s config, which means it works everywhere a cost graph does: a dashboard card, a saved cost report, or the ad-hoc graphs on the Costs panel.
From the CLI
infrawrench scenarioslists the organization’s models with every adjustment and its scope.
infrawrench scenarios "Q4 plan" --last 60dapplies one to the org’s forecast. It prints the trend total and the adjusted total together, then a per-adjustment breakdown of what each one contributed over the horizon, then anything that fell outside the query’s scope. --json gives you both projections as arrays so a script can diff them without re-running the query.
From MCP and chat
Two tools:
list_scenario_models— the models and their adjustments.apply_scenario_forecast— a cost query with a model applied. It returnsforecast(the untouched trend) andscenario(the adjusted projection) together, pluscontributions,outOfScopeandconvertedFrom. The tool description tells the assistant never to report one without the other.
From the API
GET, POST, PUT, DELETE /api/org/{orgId}/cost-scenarios manage models (costs:read / costs:write), and GET /cost-scenarios/{id}/referents answers “what would break if I changed this”.
To apply one, send scenarioModelId alongside forecast: true on POST /costs/query. The response carries the untouched forecast and a scenario object with the adjusted points, per-adjustment contributions, the signed totalDelta, any convertedFrom currency, and the outOfScope labels. Sending scenarioModelId without a forecast is a 400, not a no-op — a caller who asked for assumptions and silently got none back is exactly the failure this feature exists to prevent. See the OpenAPI spec.
On mobile
The mobile app draws an applied scenario read-only: the second dashed line, the model’s name in the legend, and the same caption naming the model and its total effect. Authoring and editing models is deliberately web and desktop only — the editor is a table of dated, scoped, currency-bearing rows, and a phone is the wrong place to get one of those right.