Cost per change & cost per deploy
What a change or a deployment actually did to your bill — a run-rate delta measured from collected provider spend either side of it, with the confidence to go with it.
Every change in the change timeline and every run in the deploy history can answer one more question: what did that cost?
Infrawrench compares the affected resource’s per-day spend over a window before the change against the window after, and reports the difference as a run-rate delta — money per day, not money in total. A total would describe two spans of time. A rate describes what the estate now costs to own, which is the thing a change actually altered.
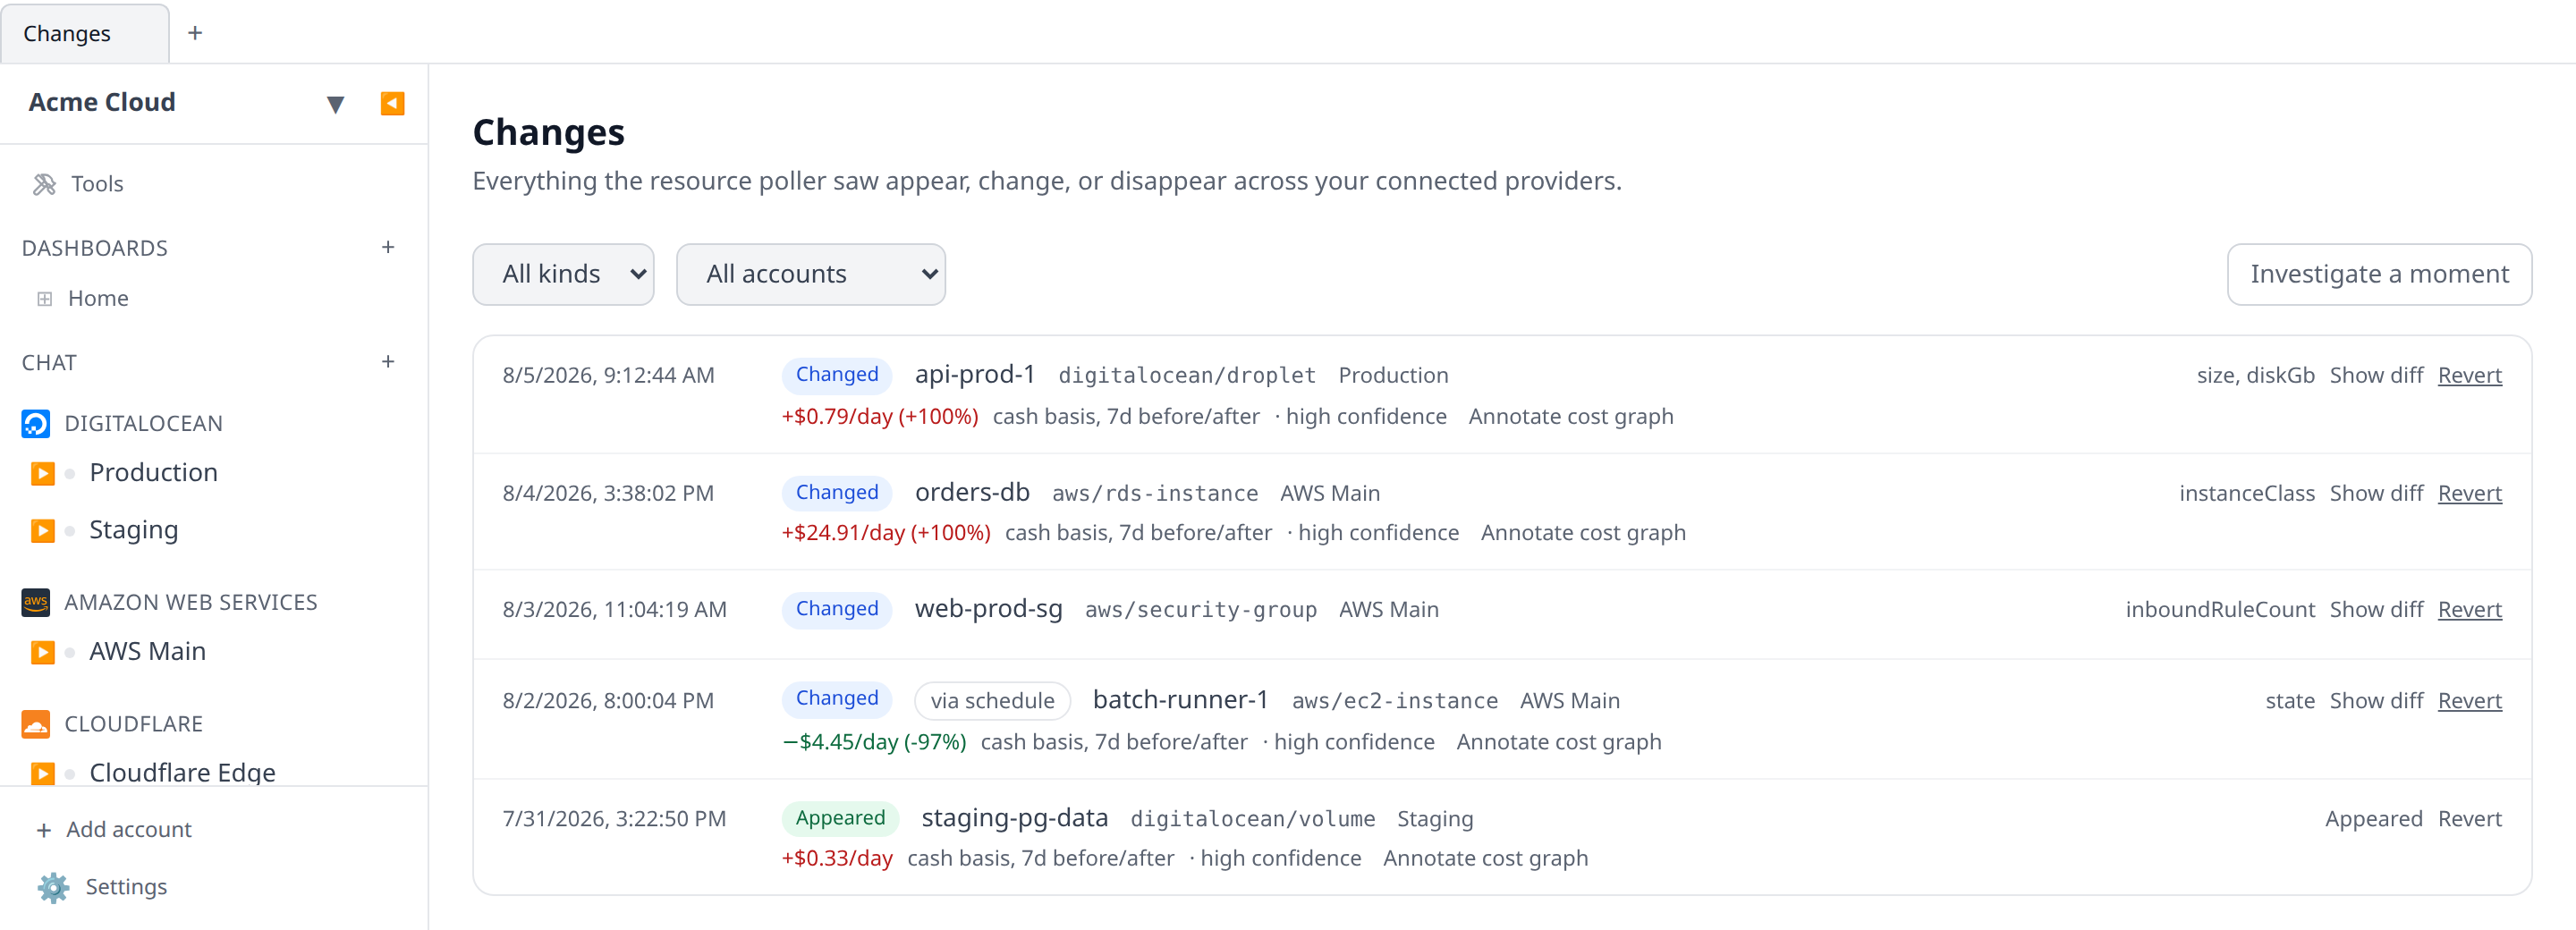
Reading the line
A cost-impact line looks like this:
+$42.37/day (+118%) · cash basis, 7d before/after · high confidenceEvery part of it is load-bearing.
- The delta is
after − before, per day. Positive means the change costs more. - The percentage is against the “before” window. It is omitted when the before window spent nothing — a resource that came into being has no percentage, and printing one would divide by nothing.
- The basis — see Which numbers are compared below. It is always printed, never assumed.
- The window is how many days were compared on each side, after clamping to the data that exists.
- The confidence is how much the number is worth believing.
Hover the window text to see the exact date spans that were compared.
Which numbers are compared
Both windows are read on one charge-type basis, and the basis is named on every figure.
- Cash (the default) — what the provider charged on the day it charged it.
- Amortized — a commitment’s up-front fee spread across the term it buys.
They answer different questions, and a comparison that silently mixed them would be worse than no comparison at all: an amortized “after” against a cash “before” on a commitment-covered resource looks exactly like a saving nobody made. There is no code path that can mix them, and the response echoes the basis it used so no screen can print a bare number.
The same two bases are available on cost graphs and cost reports.
Which days are compared
All windows are whole UTC days.
- The day of the change is in neither window. On that day the resource was billed partly under the old shape and partly under the new one. Including it drags both figures toward each other and understates every real change.
- Today is never in a window. The current day is still accruing, so it always reads as a dip.
- The window shrinks symmetrically to whatever the data supports. If only three complete days have passed since the change, the “before” window is shortened to three days too, so the two averages cover the same number of days. Comparing a settled seven-day average against a noisy two-day one prints the noise as a finding.
The default is 7 days either side, adjustable between 2 and 30 through the API.
When Infrawrench says “unknown” — and why that is not “$0”
“This change cost nothing” and “we cannot say what this change cost” are different answers, and
keeping them apart is the whole point of the feature. A resource we hold no spend for reports
unknown, never $0.00/day.
You will see unknown when:
| Reason | What it means |
|---|---|
| No provider id to match spend to | The resource has no provider-native id, so no billing row can be keyed to it. More data will not help. |
| No spend recorded for this resource | Cost was collected across the window, but this resource never appears in it. Security groups, IAM roles and the like are simply not billed. |
| Provider bills by invoice period | The provider files a whole invoice period against the period’s first day, so a day-window comparison would either swallow a month’s bill or miss it. |
| Cost collection had not started | The “before” window predates the first day this account has spend for. |
| Not enough days have passed | Provider billing for the days after the change has not landed yet. This one resolves itself — check back. |
A resource that was billed on one side and genuinely not on the other is a real measurement, not an unknown: a deleted instance correctly reports a saving, and a newly created one correctly reports its full cost as an increase.
Confidence, and why a delta is not a verdict
The number is a correlation. Something changed, and the bill moved. That is not proof the change caused it, and Infrawrench does not claim otherwise.
Confidence starts from how many comparable days each side had — seven or more is high, four or more
is medium, otherwise low — and then drops one tier when other recorded changes touched the same
resource inside the window. When that happens the line says (contested), and hovering it names
how many.
If you need a clean read, look for a change with no overlaps and a full window.
Deployments
A deploy usually touches more than one resource, so its cost impact is a per-resource breakdown that sums to the total.
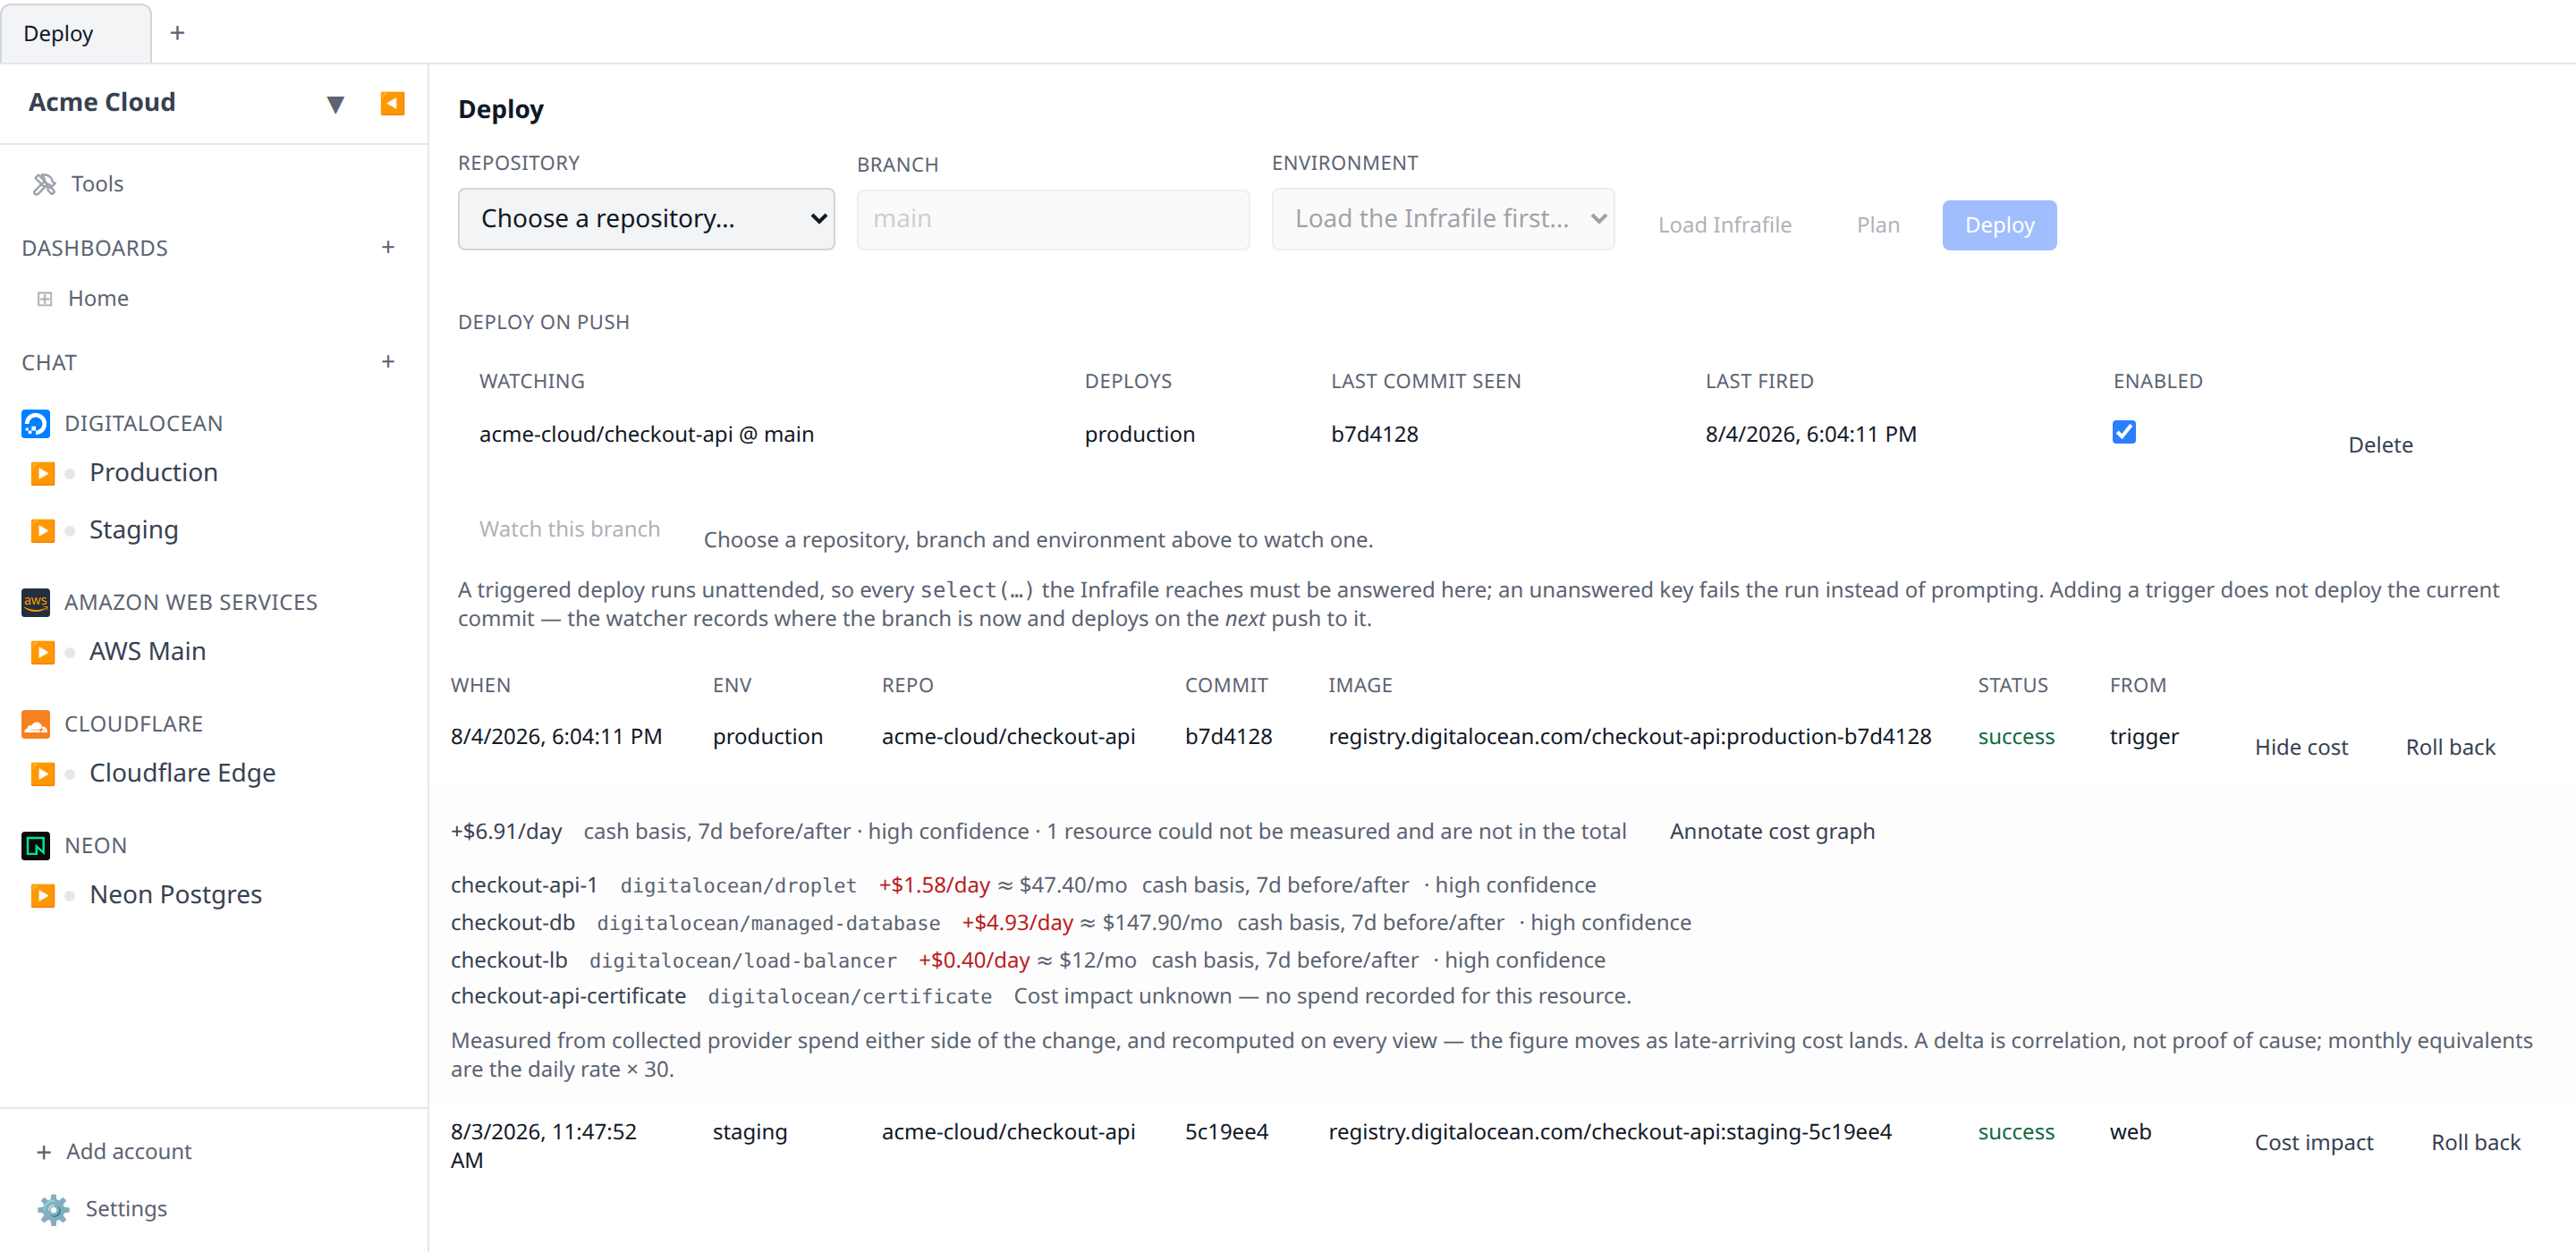
Two things about that total:
- It covers the resources the run provisioned through
infra.accounts.*.create(...)in the Infrafile. That is the only set attributable to a run with certainty. A deploy that merely re-shipped an image links to no resources and says so, rather than blaming whatever else drifted in the same hour. - Resources whose impact could not be measured are excluded from the total and counted separately, so the breakdown always adds up to the figure above it. The run’s confidence is the weakest of its rows.
The window is anchored on the run’s start, not its finish — a long build’s cost consequences begin when the resources appear.
Pinning a finding to the cost graphs
Annotate cost graph writes the finding as a cost annotation, so the step in the run rate is explained on the chart where it shows up. Needs the cost write permission.
Pinning the same change or deploy again rewords the existing note rather than adding a second one — which is what makes it safe to pin a finding early and pin it again a week later once the provider has finished restating. The note’s date and report scope are never rewritten: you may have moved or widened them deliberately.
A change with no measurable impact cannot be annotated. A note reading “$0.00/day” would say something we did not measure.
The number keeps moving, on purpose
Nothing here is stored. Every view recomputes the comparison from the spend collected so far.
That is deliberate, and it is the property the feature lives or dies on. Providers publish billing
late and then restate it for days afterwards. A figure calculated the morning after a deploy is
calculated against data that is still arriving, and a stored answer would freeze that wrong number
forever. Recomputing on read means the number simply gets better as the data fills in — a deploy
that read +$4/day with low confidence on Tuesday reads +$18/day with high confidence by the
following week, without anything having to invalidate a cache.
Where it shows up
| Surface | What you get |
|---|---|
| Changes (web, desktop) | A cost line under each row, plus Annotate cost graph. |
| Deploy (web, desktop) | Cost impact on each successful run, expanding to the per-resource breakdown. |
| Mobile | The cost line on change rows and in the change detail; tap a successful deploy for its breakdown. Read-only — annotating is a web and desktop action. |
| Weekly digest | A Biggest cost move line naming the week’s largest measured mover, with its basis and window. |
The weekly digest line is deliberately separate from its Projected spend line: the projection is what the plugins’ rate cards think new resources will cost, while this is what the provider’s own billing says a specific change actually did.
Requirements
- Cloud only. The comparison reads collected provider spend, which the desktop’s local mode does not have.
- At least one account with cost collection working, covering both windows.
costs:readto see impacts,costs:writeto annotate.