Investigate a moment
Enter a timestamp and get one merged, chronological narrative of everything that happened around it — changes, incidents, cost anomalies, workflow runs, deployments, audit entries and freezes.
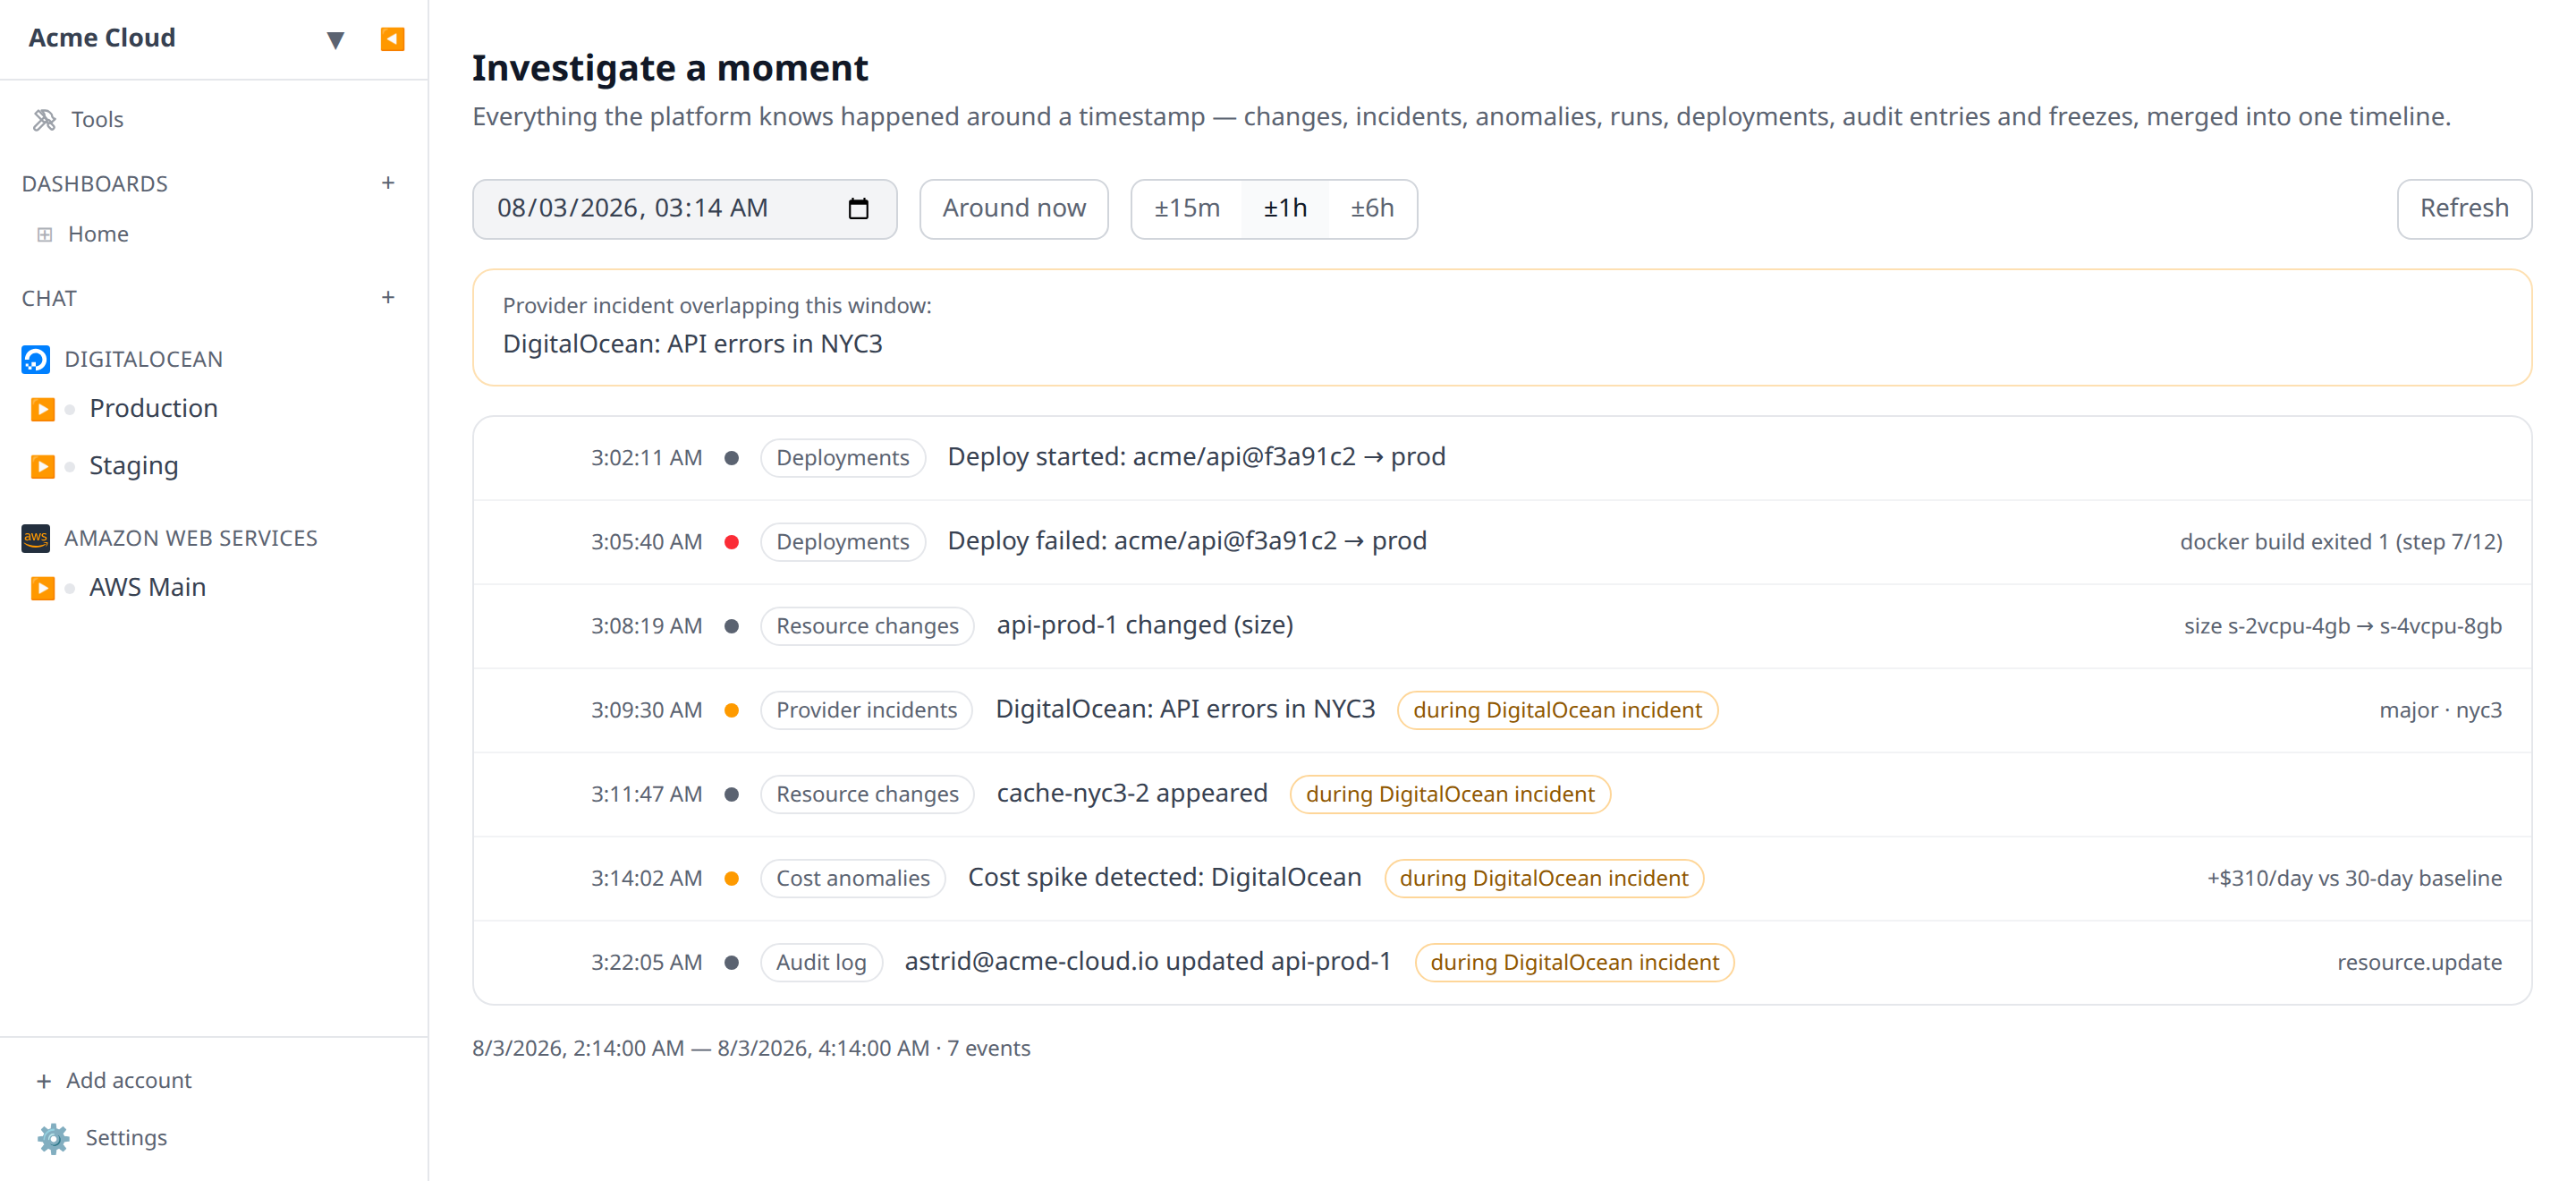
Something broke around 03:14. The change timeline knows a droplet resized, the status feed knows DigitalOcean was having a bad night, the deploy log knows someone shipped at 03:02, and the audit log knows who — but each of those lives on its own screen, and at 3am nobody wants to open five tabs and cross-reference timestamps by eye.
The moment view answers the actual question: “what changed around 03:14?” One timestamp box, a window size (±15m / ±1h / ±6h), and one merged, chronological narrative of everything the platform already knows happened in that window.
What’s in the narrative
The view unions the feeds Infrawrench already indexes — it collects nothing new:
- Resource changes — everything the poller saw appear, change, or disappear, including the “via sleep/wake schedule” attribution on scheduled stops and starts. See Change timeline.
- Provider status incidents — incidents that started or resolved in the window, or span it. See Provider status.
- Cost anomalies — spikes and new spend sources by detection time. See Cloud costs.
- Workflow runs — starts, successes, failures and cancellations. See Workflows.
- Deployments — deploy starts and finishes, with failures marked. See Infrafile.
- Audit-log entries — who created, updated, deleted, froze or unfroze what. See Audit log.
- Change freezes — freezes that started or ended in the window. See Change freezes.
- Drift and expiry alert deliveries — when the org’s drift digest or expiry radar alert went out. (These feeds keep no per-event history, only their most recent delivery, so each contributes at most one event per window.)
Every event carries a severity, and each row deep-links to its native screen — the resource, the workflow, the deploy log, the provider’s incident page.
Correlation, not just concatenation
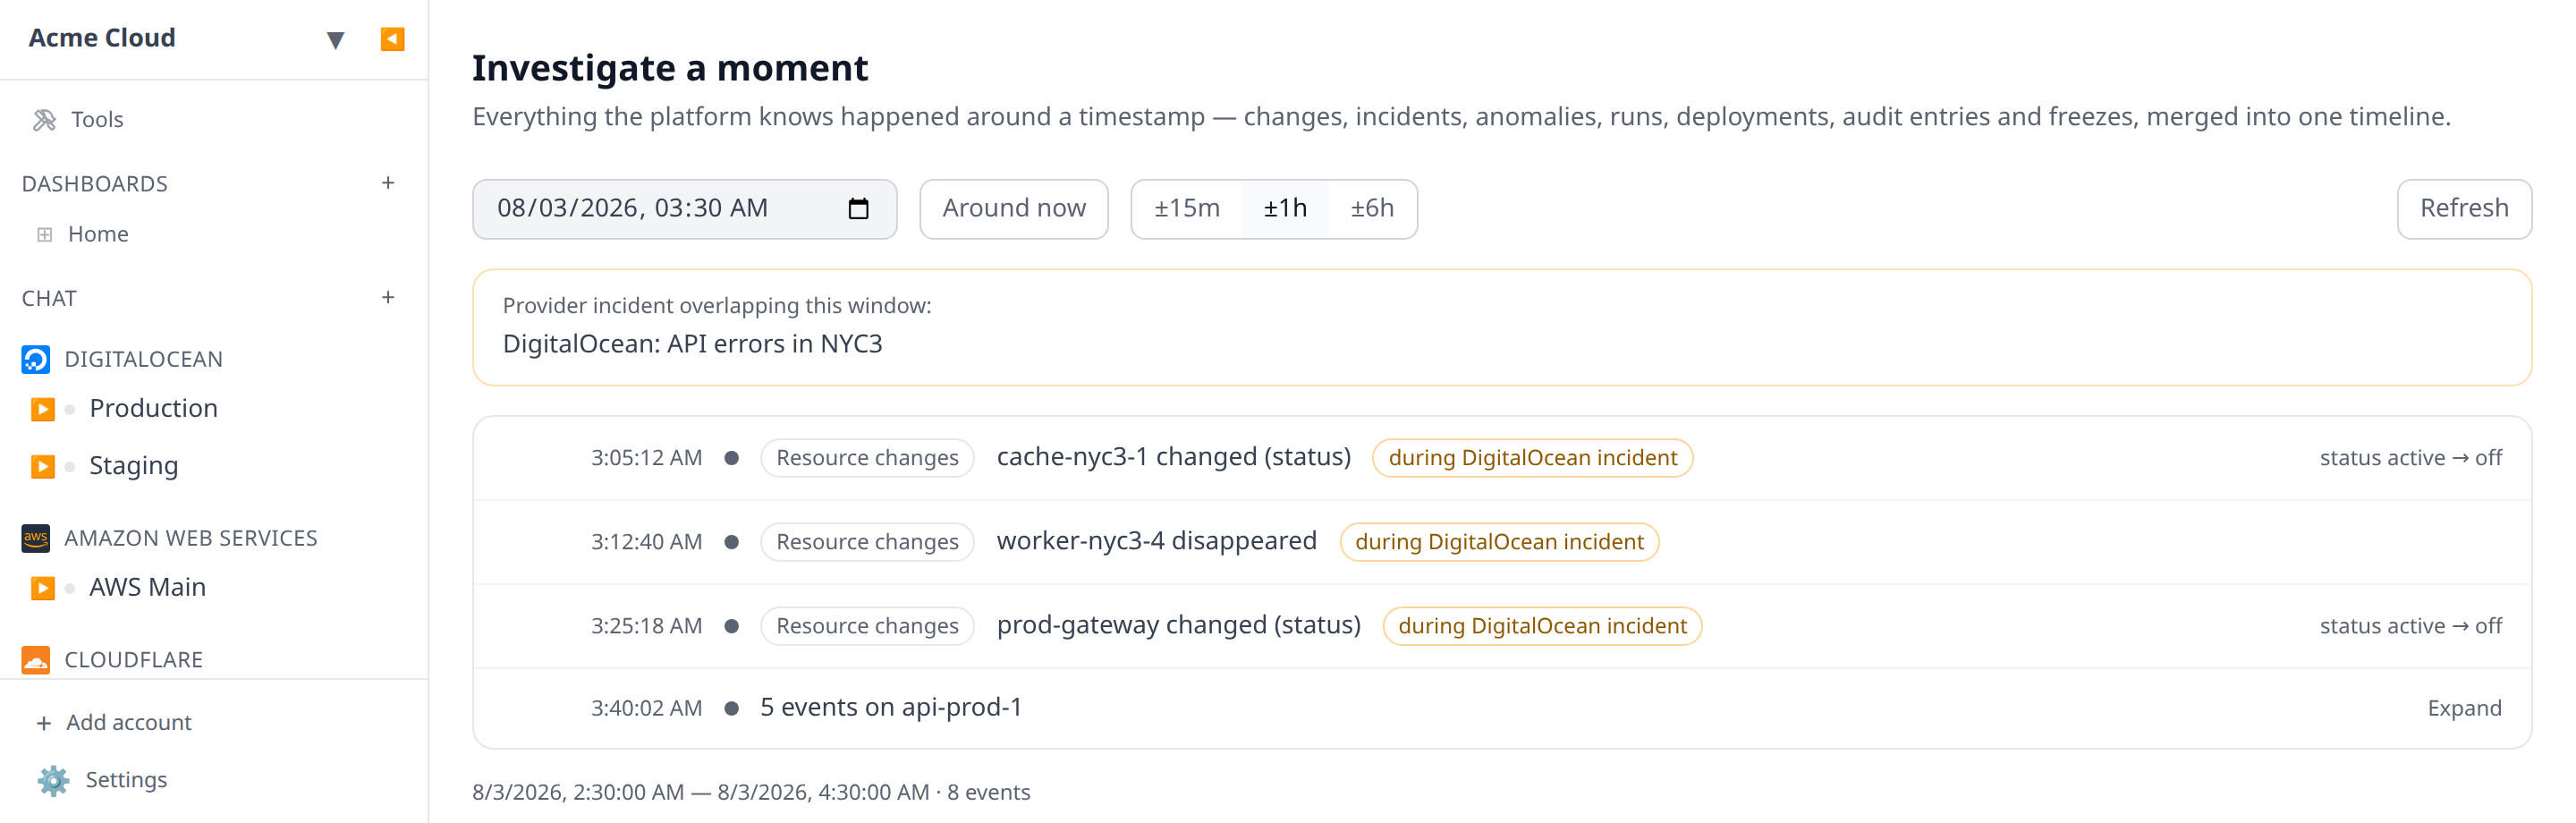
When a provider incident overlaps the window, every event that falls inside the incident’s span gets a “during DigitalOcean incident” badge — the “is it me or is it them?” correlation applied to the whole narrative rather than one feed. Dense bursts — several changes to the same resource within minutes — collapse into one expandable group, so a flapping machine reads as one line, not thirty.
Permissions and partial failure
The union respects the same per-feed permissions as the individual screens: a member whose role can’t read the audit log gets a narrative with the audit feed marked omitted, not a hole they can’t explain. And one feed failing never blanks the screen — the merged timeline still renders, with a chip saying, e.g., “Workflow runs unavailable”.
Getting there
- From the Changes page — the Investigate a moment button on web, desktop and mobile.
- By deep link — the timestamp and window ride in the URL (
/org/…/moment?at=2026-08-03T03:14:00Z&window=60), so a moment is shareable and an alert can link straight into its window. - From a push notification — cost-anomaly, drift and provider-incident pushes on mobile open the moment view centred on their window.
The CLI
infrawrench moment [timestamp] prints the same merged window in the terminal — omit the timestamp for “around now”, zoom with --window, and script it with --json:
$ infrawrench moment 2026-08-03T03:14 --window 1h
Acme Corp · 2026-08-03 02:14:00 → 2026-08-03 04:14:00 UTC (±60m around 2026-08-03 03:14:00)

Provider incidents overlapping this window
  ▲ DigitalOcean: API errors in NYC3 (active) https://status.digitalocean.com/…

  03:02:11 · [Deployments] Deploy started: acme/api@f3a91c2 → prod
  03:05:40 ✗ [Deployments] Deploy failed: acme/api@f3a91c2 → prod
  03:08:19 · [Resource changes] api-prod-1 changed — size (during DigitalOcean incident)
  03:14:02 ! [Cost anomalies] Cost spike detected: DigitalOcean
MCP
The what_changed tool exposes the union to AI agents — a timestamp and a window in, typed events and per-feed statuses out. An agent asked “why did the site go down at 03:14?” can pull the whole narrative in one call and reason over it, respecting the caller’s per-feed permissions exactly like the screen. See MCP.
Caveats
- The narrative is only as long as its sources’ retention — resource changes keep 90 days, so a moment from last quarter thins out.
- Drift and expiry alert deliveries record only their most recent send, so older windows won’t show them even if one fired then.
- Incident badges are correlation, not causation: “these changes happened during an incident” is a hint about where to look, not a verdict.
See also: Incident mode (which reuses this same union to build a declared incident’s timeline), Change timeline, Provider status, Cloud costs, Audit log, CLI, MCP.