Unit costs & margin
Divide your spend by the thing your business actually does — cost per customer, per request, per GB — and, for revenue metrics, margin.
A cost graph answers “are we spending more”. It cannot answer “are we spending more per customer”, and that is the question that decides whether a rising bill is growth or waste.
A business metric is the missing half: a number only you know — active customers, API requests, GB processed, revenue — reported once per day. Point a cost graph at one and it draws cost per unit instead of cost.
Cloud only. Unit costs divide collected spend, which lives in Infrawrench Cloud’s cost store. The desktop app shows them when you are signed into a cloud org; local-only mode has no spend to divide.
The short version
- Declare a metric on the Costs panel — its name, its key, and what one of it is called.
- Report a value for each day, from a workflow, over the API, or by hand.
- On any cost graph, choose Divide by a business metric.
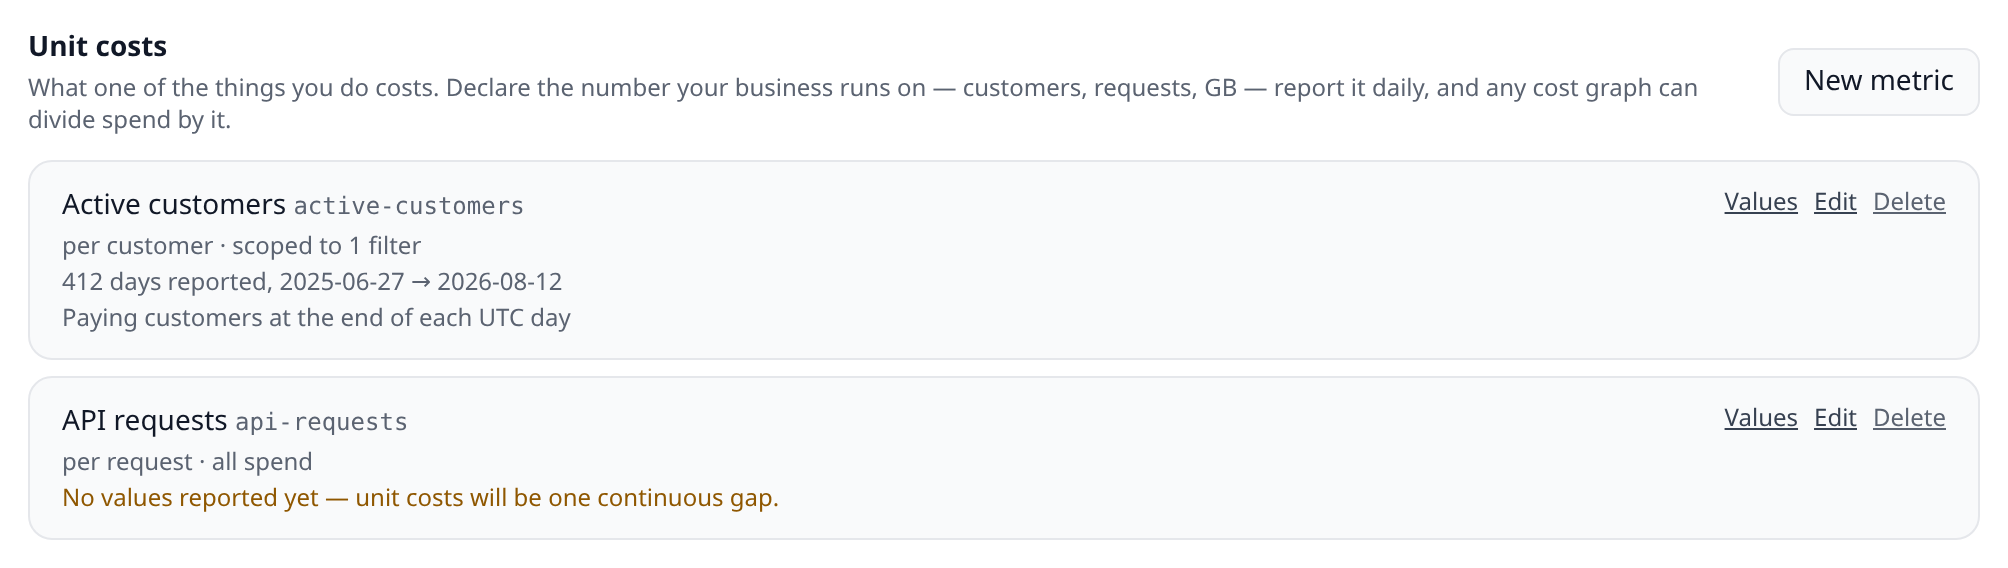
Declare a metric
Costs → Unit costs → New metric.
| Field | What it is |
|---|---|
| Name | What people call it — “Active customers”. |
| Key | A lowercase slug — active-customers. This is what workflows, the CLI and the API address it by, and it survives a rename. |
| Unit | The singular noun in “USD per customer”. |
| Kind | Count for a quantity, Revenue (money) for money the business took in. Only a revenue metric can have margin computed. |
| Currency | Revenue metrics only, and required for them — margin subtracts spend from revenue, which is only defined in one currency. |
| Cost scope | Which spend this metric divides. Empty means all of it. |
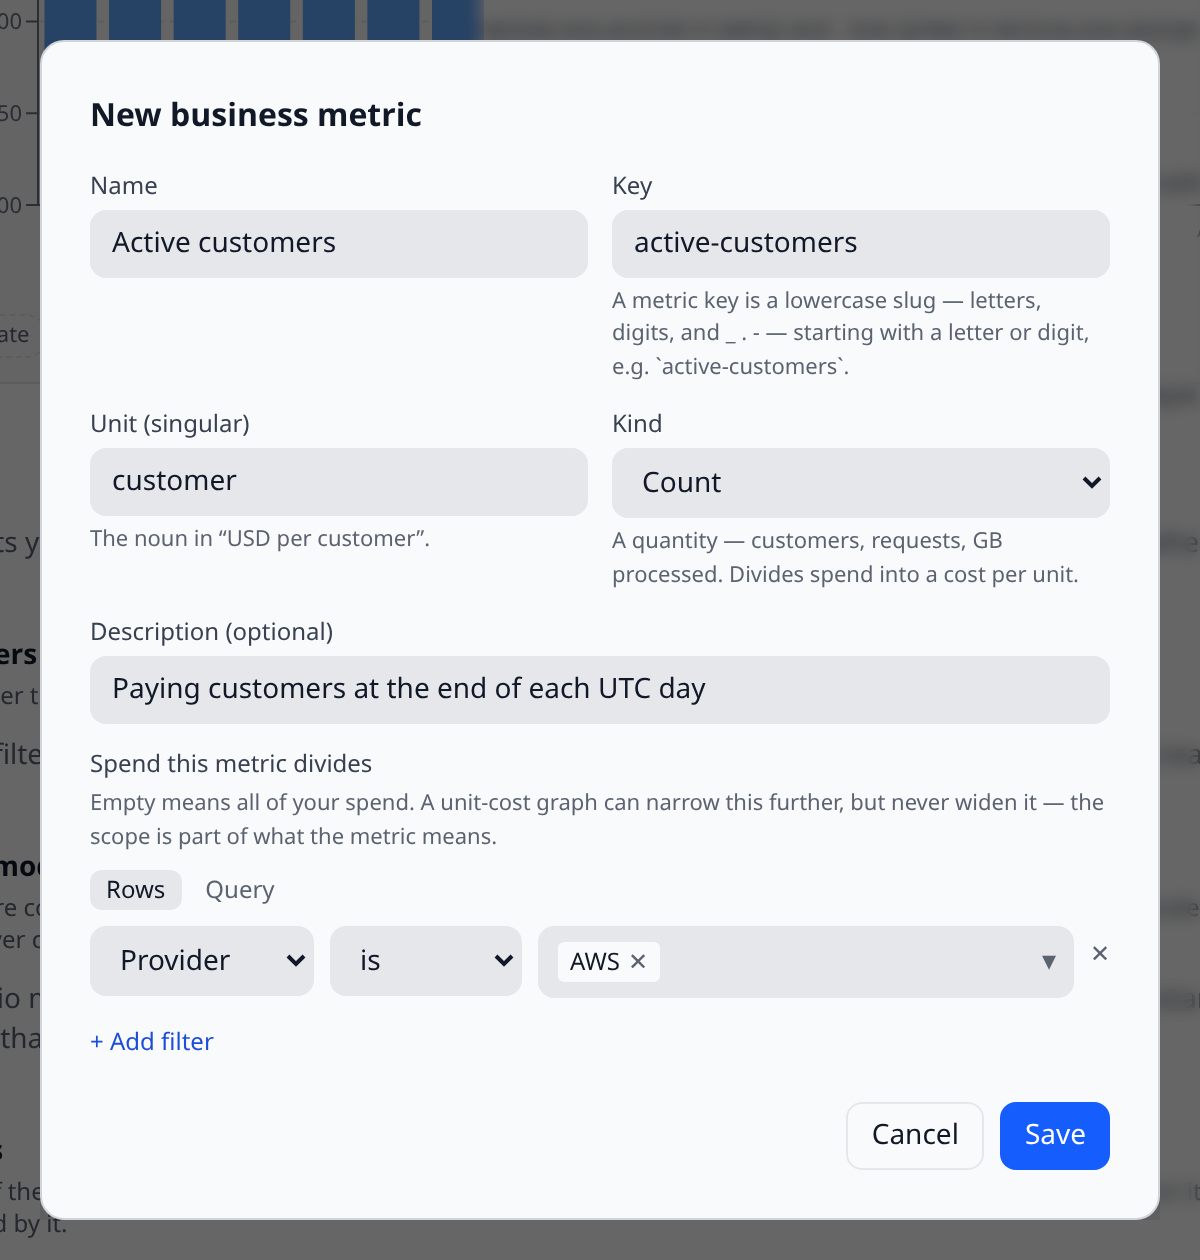
Cost scope is part of what the metric means
“Cost per customer” is only honest if the numerator is the spend that serves customers. So the scope lives on the metric, in the same filter vocabulary graphs and budgets use, and a graph can narrow it further but never widen it. A graph that could drop the scope would be answering a different question under the same name.
Report values
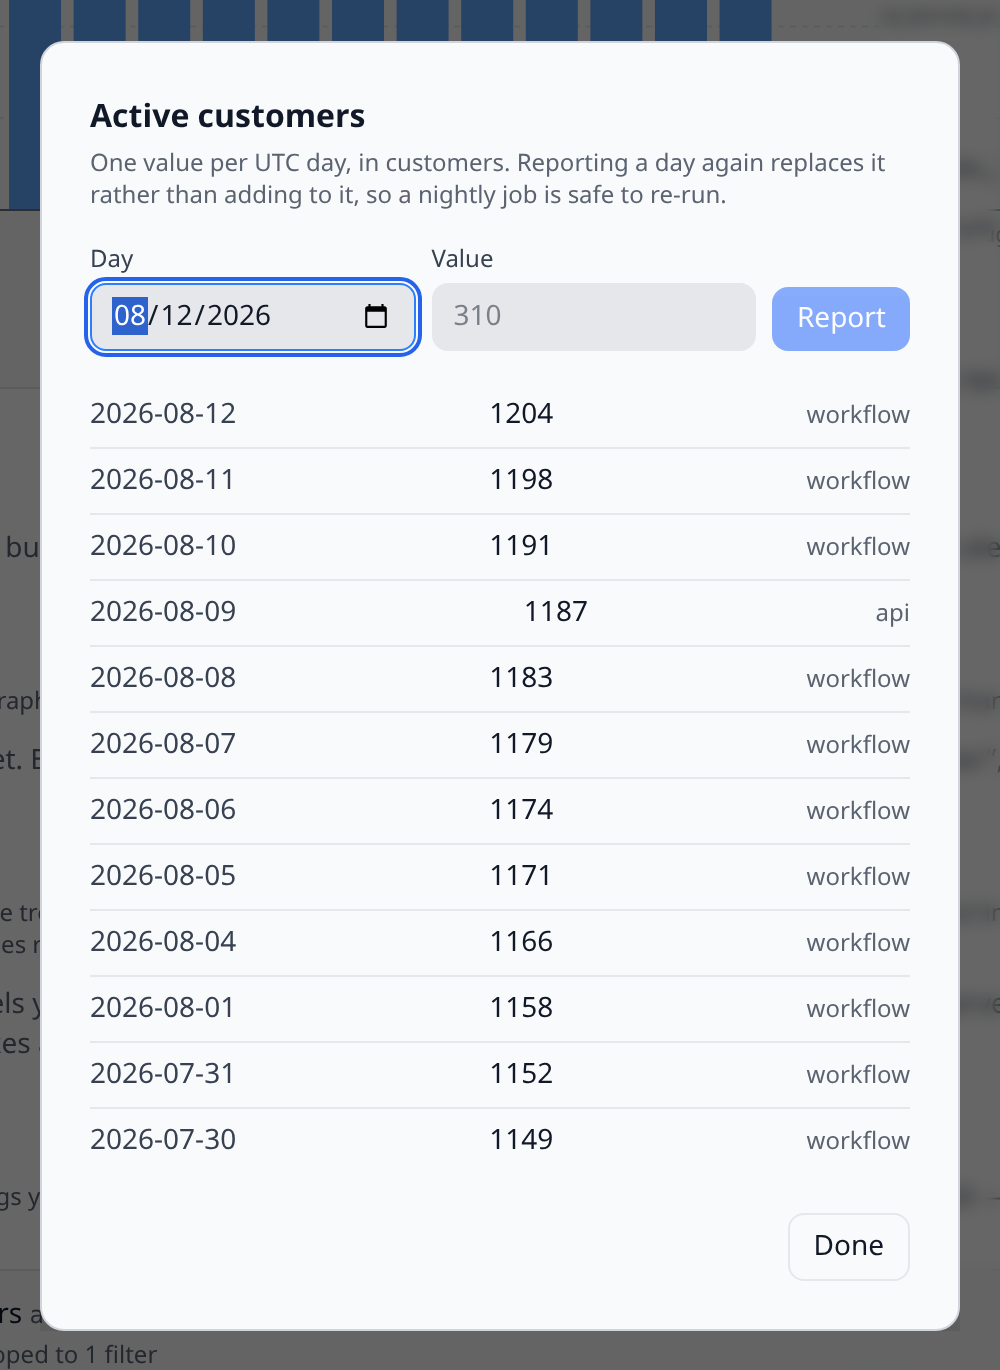
One value per UTC day. Re-reporting a day replaces it rather than adding to it, so a nightly job is safe to retry — an ingest that accumulated would double every number the first time the job re-ran, and nothing about the resulting chart would look wrong.
From a workflow
const rows = await infra.accounts.postgres.prod.query(
  "select count(*) as n from customers where status = 'active'",
);

await infra.businessMetrics.write("active-customers", [{ date: "2026-08-09", value: rows[0].n }]);
It is
infra.businessMetrics, notinfra.metrics— that name already belongs to the workflow’s own declared metrics. See Workflows.
Over the API
curl -X POST \
  "$INFRAWRENCH/api/org/$ORG/business-metrics/active-customers/values" \
  -H "Authorization: Bearer $INFRAWRENCH_API_KEY" \
  -H "Content-Type: application/json" \
  -d '{"values":[{"date":"2026-08-09","value":1204}]}'
Needs costs:write. The endpoint accepts the metric’s key or its id.
By hand
Values on a metric’s row opens the reported days and lets you type one in. This is mostly for confirming the metric is wired up at all, and for correcting a bad number — send the day again with the right value.
Draw it
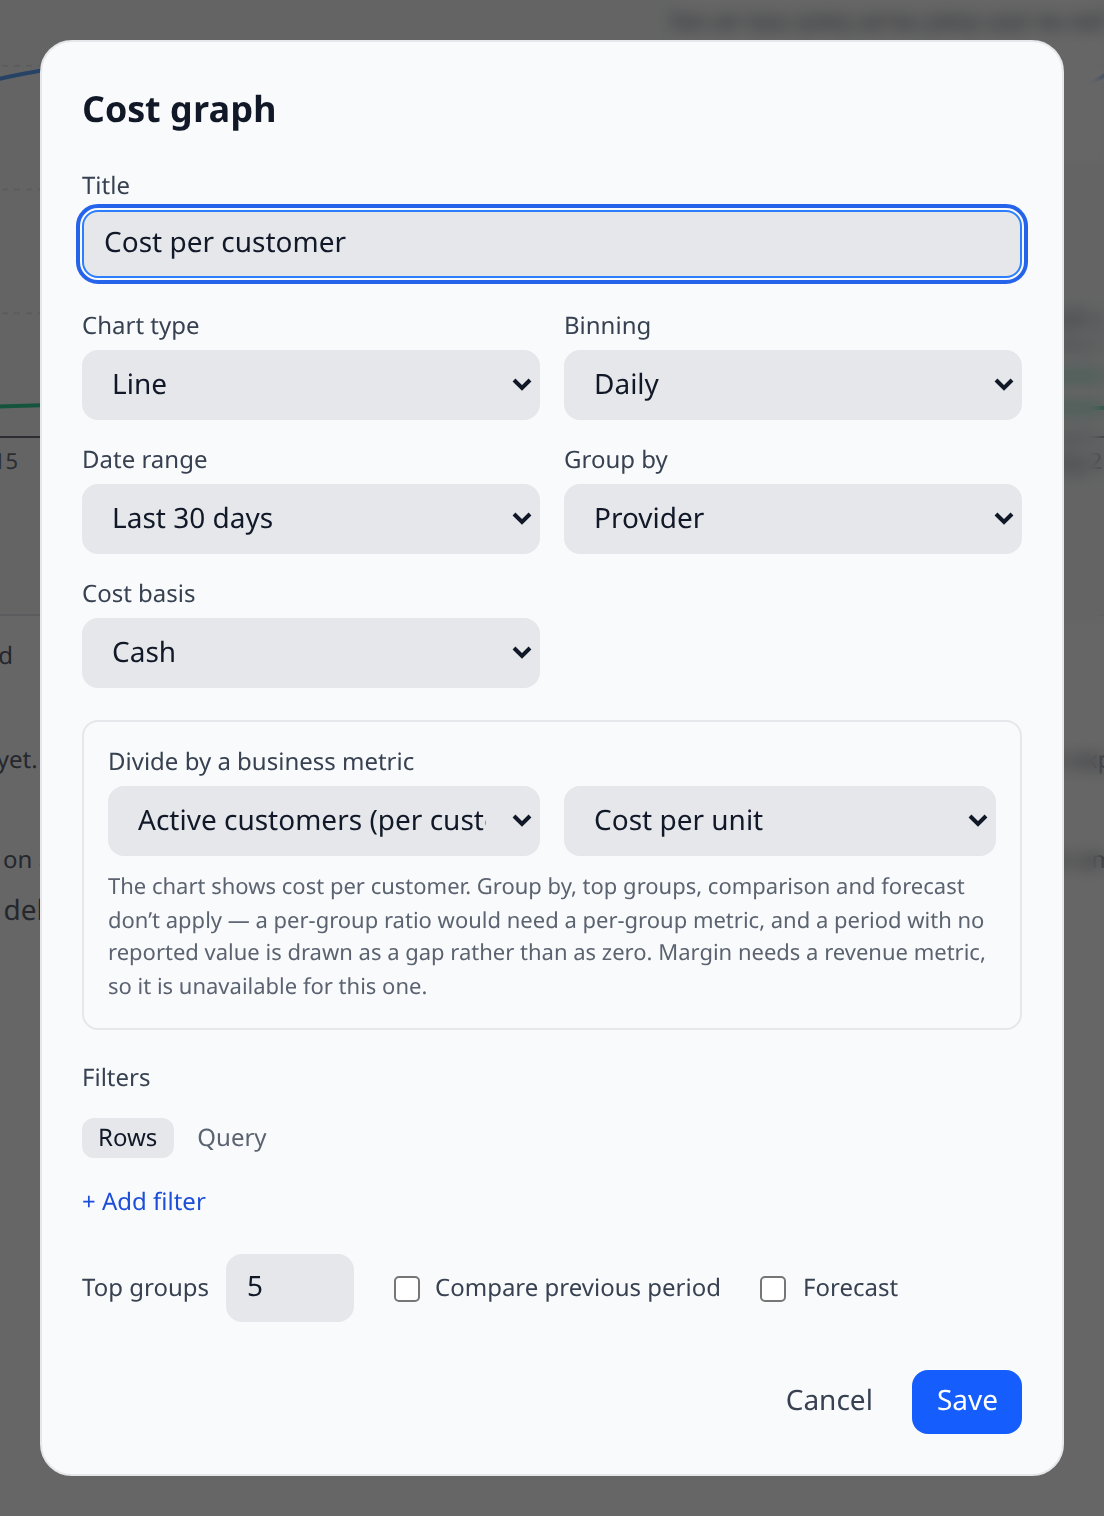
Open any cost graph’s editor and pick a metric under Divide by a business metric. It is a mode of the graph you already have, not a different chart: the date range, the binning, the filters and the cost basis all still describe the numerator.
Four options stop applying, and the editor says so:
- Group by and Top groups — a per-group ratio needs a per-group denominator. Dividing each service’s spend by the whole customer count gives five numbers that do not sum to the real one.
- Compare and Forecast — projecting a ratio means projecting two independent series and dividing, which is a different thing from projecting one.
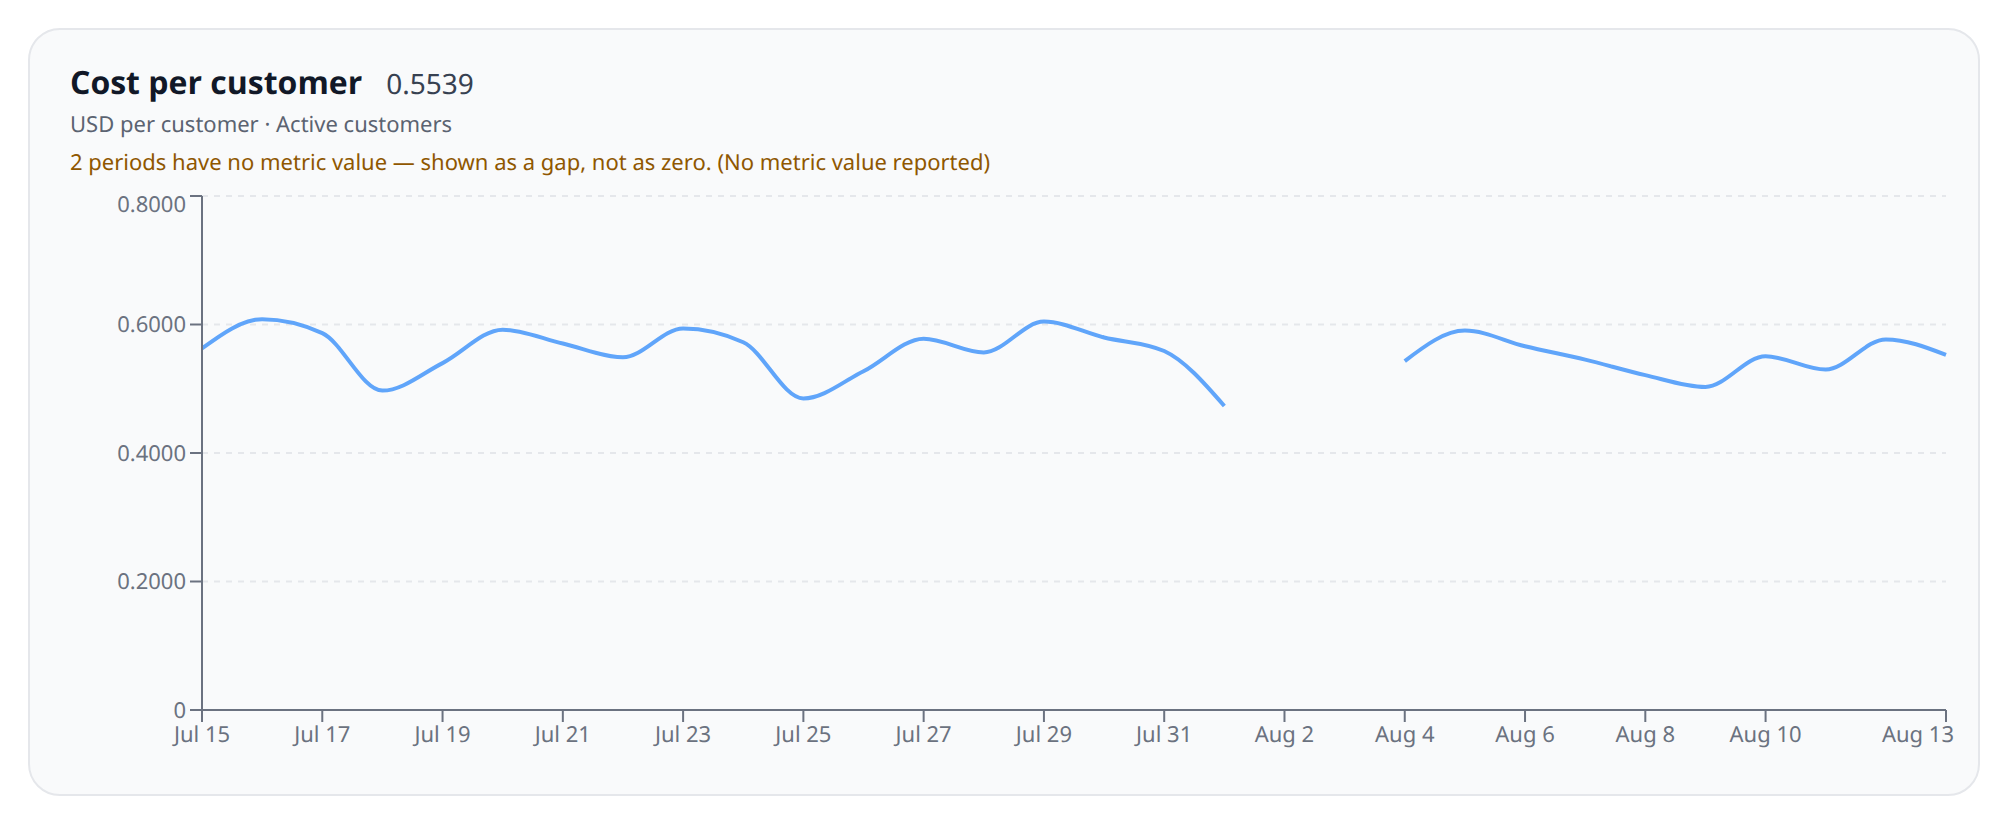
Gaps are gaps, never zero
This is the rule the whole feature stands on.
A period with no reported metric value has an unknown unit cost, not a zero one. The chart breaks the line, the CLI prints —, the API returns value: null with a gap reason, and the card says how many periods are affected. Nothing anywhere renders it as 0.
The same applies to a value of zero or below: you cannot divide by it, so it is a gap too.
A genuine zero is kept and shown as zero: no spend at all over a real denominator really does cost nothing per unit.
Partly reported periods read high
If you bin weekly but only reported five of the week’s seven days, the week has seven days of spend over five days of volume, and the ratio comes out about 40% too high. Infrawrench still computes it — throwing away five real days of data is its own distortion — but counts those periods and warns under the chart. Daily binning makes the question moot.
The arithmetic
Each period’s ratio is that period’s summed spend over its summed metric value:
unit cost(period) = Σ spend in period ÷ Σ metric value in periodNever the average of the daily ratios. On a week where volume moved, the two are different numbers, and the average is the wrong one — it weights a quiet Sunday exactly as heavily as a peak Monday.
The headline figure over the whole range works the same way: summed numerator over summed denominator, across every period that produced a ratio. Periods with no denominator are excluded from both sides — folding their spend into the numerator while their volume is missing from the denominator would inflate the answer silently.
Margin
For a metric declared Revenue (money), choose Margin instead of Cost per unit:
margin(period) = (revenue − spend) ÷ revenueIt is a fraction, shown as a percentage, and it goes negative when spend exceeds revenue rather than clamping at zero.
Margin is offered only for revenue metrics. Against a count metric it would subtract dollars from requests and divide by requests — a number that computes cleanly and means nothing — so both the editor and the API refuse it.
Currency
Spend is converted to the metric’s terms through your organization’s own stated exchange rates. Infrawrench never fetches live FX.
- Unit cost follows the graph’s display currency, exactly like a spend graph. Currencies you have stated no rate for are not dropped — they keep their own series, dividing the same metric on their own, and the caveat line says the series are not comparable to each other.
- Margin always converts to the metric’s own currency, because subtracting spend from revenue is only defined in one. Spend in a currency with no rate to it becomes a gap on its own series rather than being quietly folded in or ignored — either of which would overstate margin.
From the CLI
The verb is unit-costs, not metrics — that one already charts a resource’s provider metrics.
# The org's business metrics, and how well each is being reported.
infrawrench unit-costs

# Cost per unit over the last 90 days, weekly.
infrawrench unit-costs active-customers --last 90d --group-by weekly

# Margin, on a revenue metric.
infrawrench unit-costs mrr --margin --last 12w

# Everything, as JSON.
infrawrench unit-costs active-customers --json
Unreported periods print as — in the table, with the reason in the last column. See CLI.
Ask the model instead
The MCP server and the in-app chat expose list_business_metrics, get_business_metric_values, query_unit_costs, and the metric write tools, so “what did a customer cost us last month, and is that up or down?” works without building a graph. The tool descriptions carry the gap rule and the summed-sides rule explicitly, so a model summarising the data does not turn a gap into a zero. See MCP and AI chat.
Being told, rather than looking
A unit-cost regression alert fires when cost per unit rises more than 20% against the prior fortnight — the business signal a spend-versus-spend alert cannot see, because spend rising while cost-per-customer falls is good news. The gap rule above carries straight through: a day with no reported value contributes to neither side, and a window that is mostly gaps produces no comparison at all rather than an invented regression. A metric needs at least 10 reported days in each of the two 14-day windows before it can fire. See Commitment & unit-cost alerts.
On your phone
The mobile app’s Costs tab shows a read-only card per metric: the trailing 30 days, the period figure, and a sparkline that breaks on a gap rather than bridging it. Declaring metrics and reporting values stay on web and desktop — both are finance-governance acts needing costs:write and the full cost-filter editor, the same deliberate omission as the tag policy and exchange rates.
Permissions
Reading metrics and unit costs needs costs:read. Creating, editing, deleting a metric and reporting values need costs:write — the same permissions as saved filters and pushed cost rows. Every write is recorded in the audit log, including how many days a value batch restated.
Deleting a metric
Deleting is refused by nothing — but any cost card dividing by that metric will show an error rather than quietly reverting to plain spend. That is deliberate: a chart that silently changed what it measures is worse than one that says it is broken.