Synthetic probes
HTTP uptime and latency checks run on an interval from outside your infrastructure, with auto-suggested endpoints, latency charts, trailing uptime, and alerts after N consecutive failures.
Metrics tell you what your servers think of themselves. A synthetic probe asks the other question: can the internet actually reach this endpoint, and how fast? Point a probe at a URL and Infrawrench requests it on an interval — every 60 seconds by default — from an edge network outside your clusters and clouds, records the latency and status into the same metric store your resource charts read from, and pages you (push, Slack, Microsoft Teams) when the endpoint fails enough checks in a row.
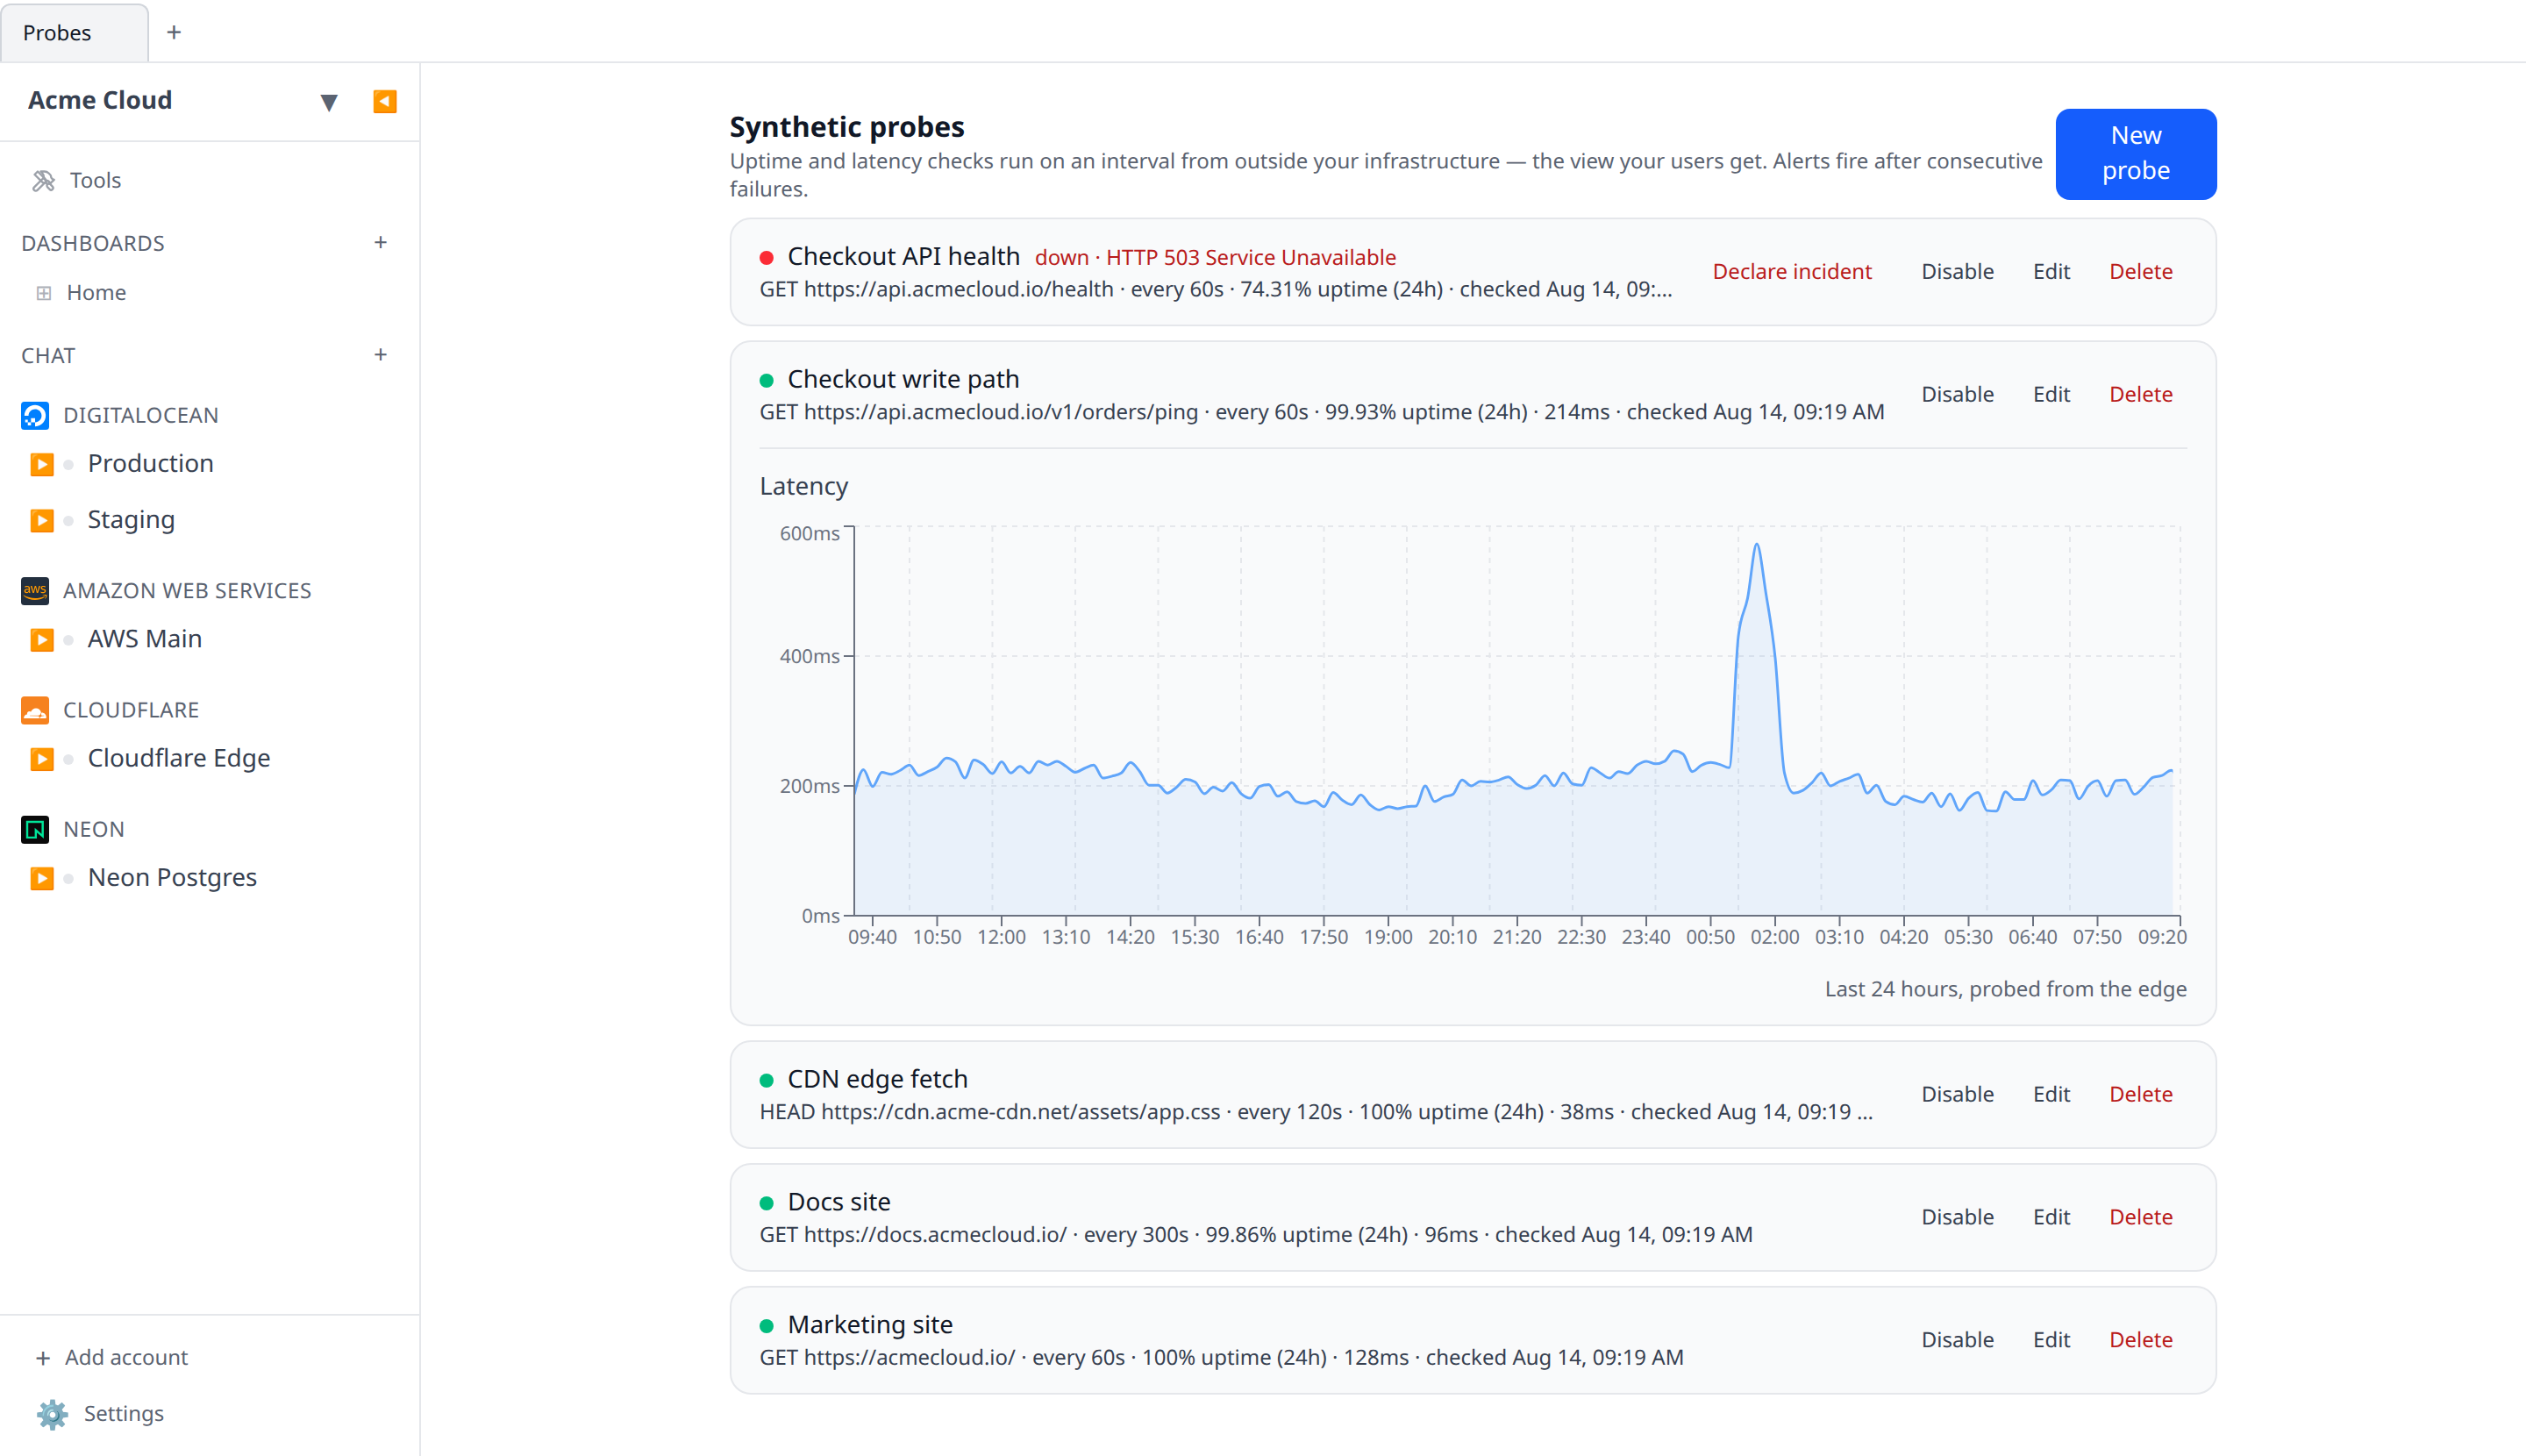
Find it under Probes in the sidebar on both the web app and the desktop app (cloud mode
— the checks run server-side). The mobile app has a read-only Probes screen for answering
“is it still down?” from wherever the push notification found you, and the infrawrench
CLI lists the same probes with infrawrench probes (give it a probe’s name for
a terminal latency chart).
You pick an endpoint, not type a URL
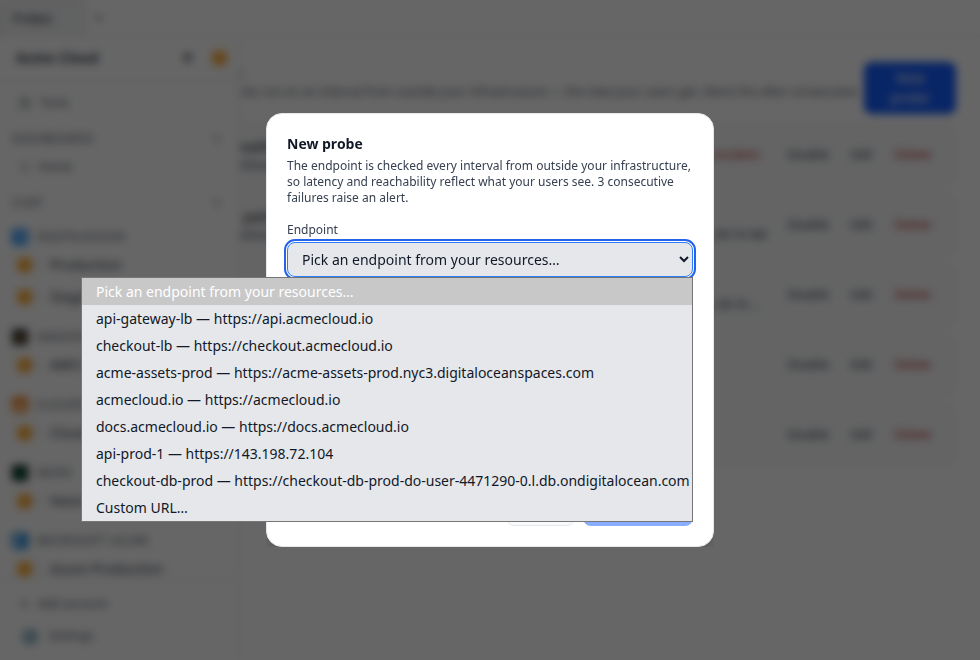
The probe editor opens with a picker of endpoints mined from resources you have already
synced — load balancer hostnames, app URLs, database public endpoints, domains, public IPs.
Choose one and the URL and name fill themselves in, and the probe remembers which resource
(and which output) it came from. There is a custom-URL option for anything Infrawrench
doesn’t know about; bare hostnames are normalized to https://.
A probe’s settings:
- Method — GET, HEAD or OPTIONS. Probes never send request bodies.
- Interval — seconds between checks, minimum 60.
- Timeout — how long a check waits before counting as a failure (default 10s).
- Failures before alert — the consecutive-failure threshold (default 3; see below).
What counts as up
A check is up when the request completes with a status below 500. A 404 or a 401
means the endpoint is alive and answering — an auth wall in front of a healthy service
should not page anyone — while a 5xx, a timeout, a TLS failure, or an unreachable host
counts as down. Latency is measured to first response from the edge, and the response
body is discarded unread.
Because the request leaves from an edge network rather than from Infrawrench’s own cluster, the numbers reflect the path your users take — DNS, TLS handshake, and all — and an outage of your ingress is visible even when everything behind it reports healthy.
Alerting on consecutive failures
One failed check is usually noise. A probe flips to down — and notifies — only after it fails its configured number of checks in a row; any success resets the counter. When a down probe answers again you get a matching recovered notification, so the channel carries both halves of the story.
Probe alerts are their own notification trigger (“Probes”), so you can route them per Slack channel, per Teams webhook, and per person in mobile push preferences — see Slack alerts, Teams alerts, and Mobile push notifications.
Charts and uptime
Every check writes two series into the metric store: Latency (ms) and Up (1 or 0). The probe list shows each probe’s trailing-24-hour uptime and last latency; expanding a row charts its latency with the same chart component the resource dashboards use, and longer ranges automatically read from the per-minute and per-hour rollups.
Deleting a probe stops the checks; its recorded history ages out of the metric store with the normal retention windows.
Publishing them
The probes you already run are most of a status page. The Status pages tab lets you publish a chosen set of them at a public link — current state, uptime and 90 days of history, under names your customers would recognise, with no probe URLs or account details exposed. See Public status pages.
Requirements
Probes run through the same egress proxy that powers workflow fetch()
(WORKFLOW_FETCH_PROXY_URL / WORKFLOW_FETCH_PROXY_TOKEN on a self-hosted deployment).
Without it configured, probes simply don’t run — they exist to measure from an external
vantage point, so there is no in-cluster fallback. Private, loopback, and cluster-internal
addresses are refused by design: a probe can only target endpoints the internet can reach.
Related
- Status pages — publishing a chosen set of these probes
- Incident mode — a down probe carries a Declare incident button that opens the declare form pre-filled with the probe’s name, its error and the moment it went down