Kubernetes cost allocation
Work out what each namespace, workload, and pod in a cluster actually costs — compute, volumes, load balancers and the control-plane fee — including the capacity nobody is using.
A Kubernetes cluster has no billing API. Nothing inside it knows what it costs, because the money is not charged to the cluster — it is charged to the cloud account that owns the nodes, as a pile of virtual machines, disks and load balancers.
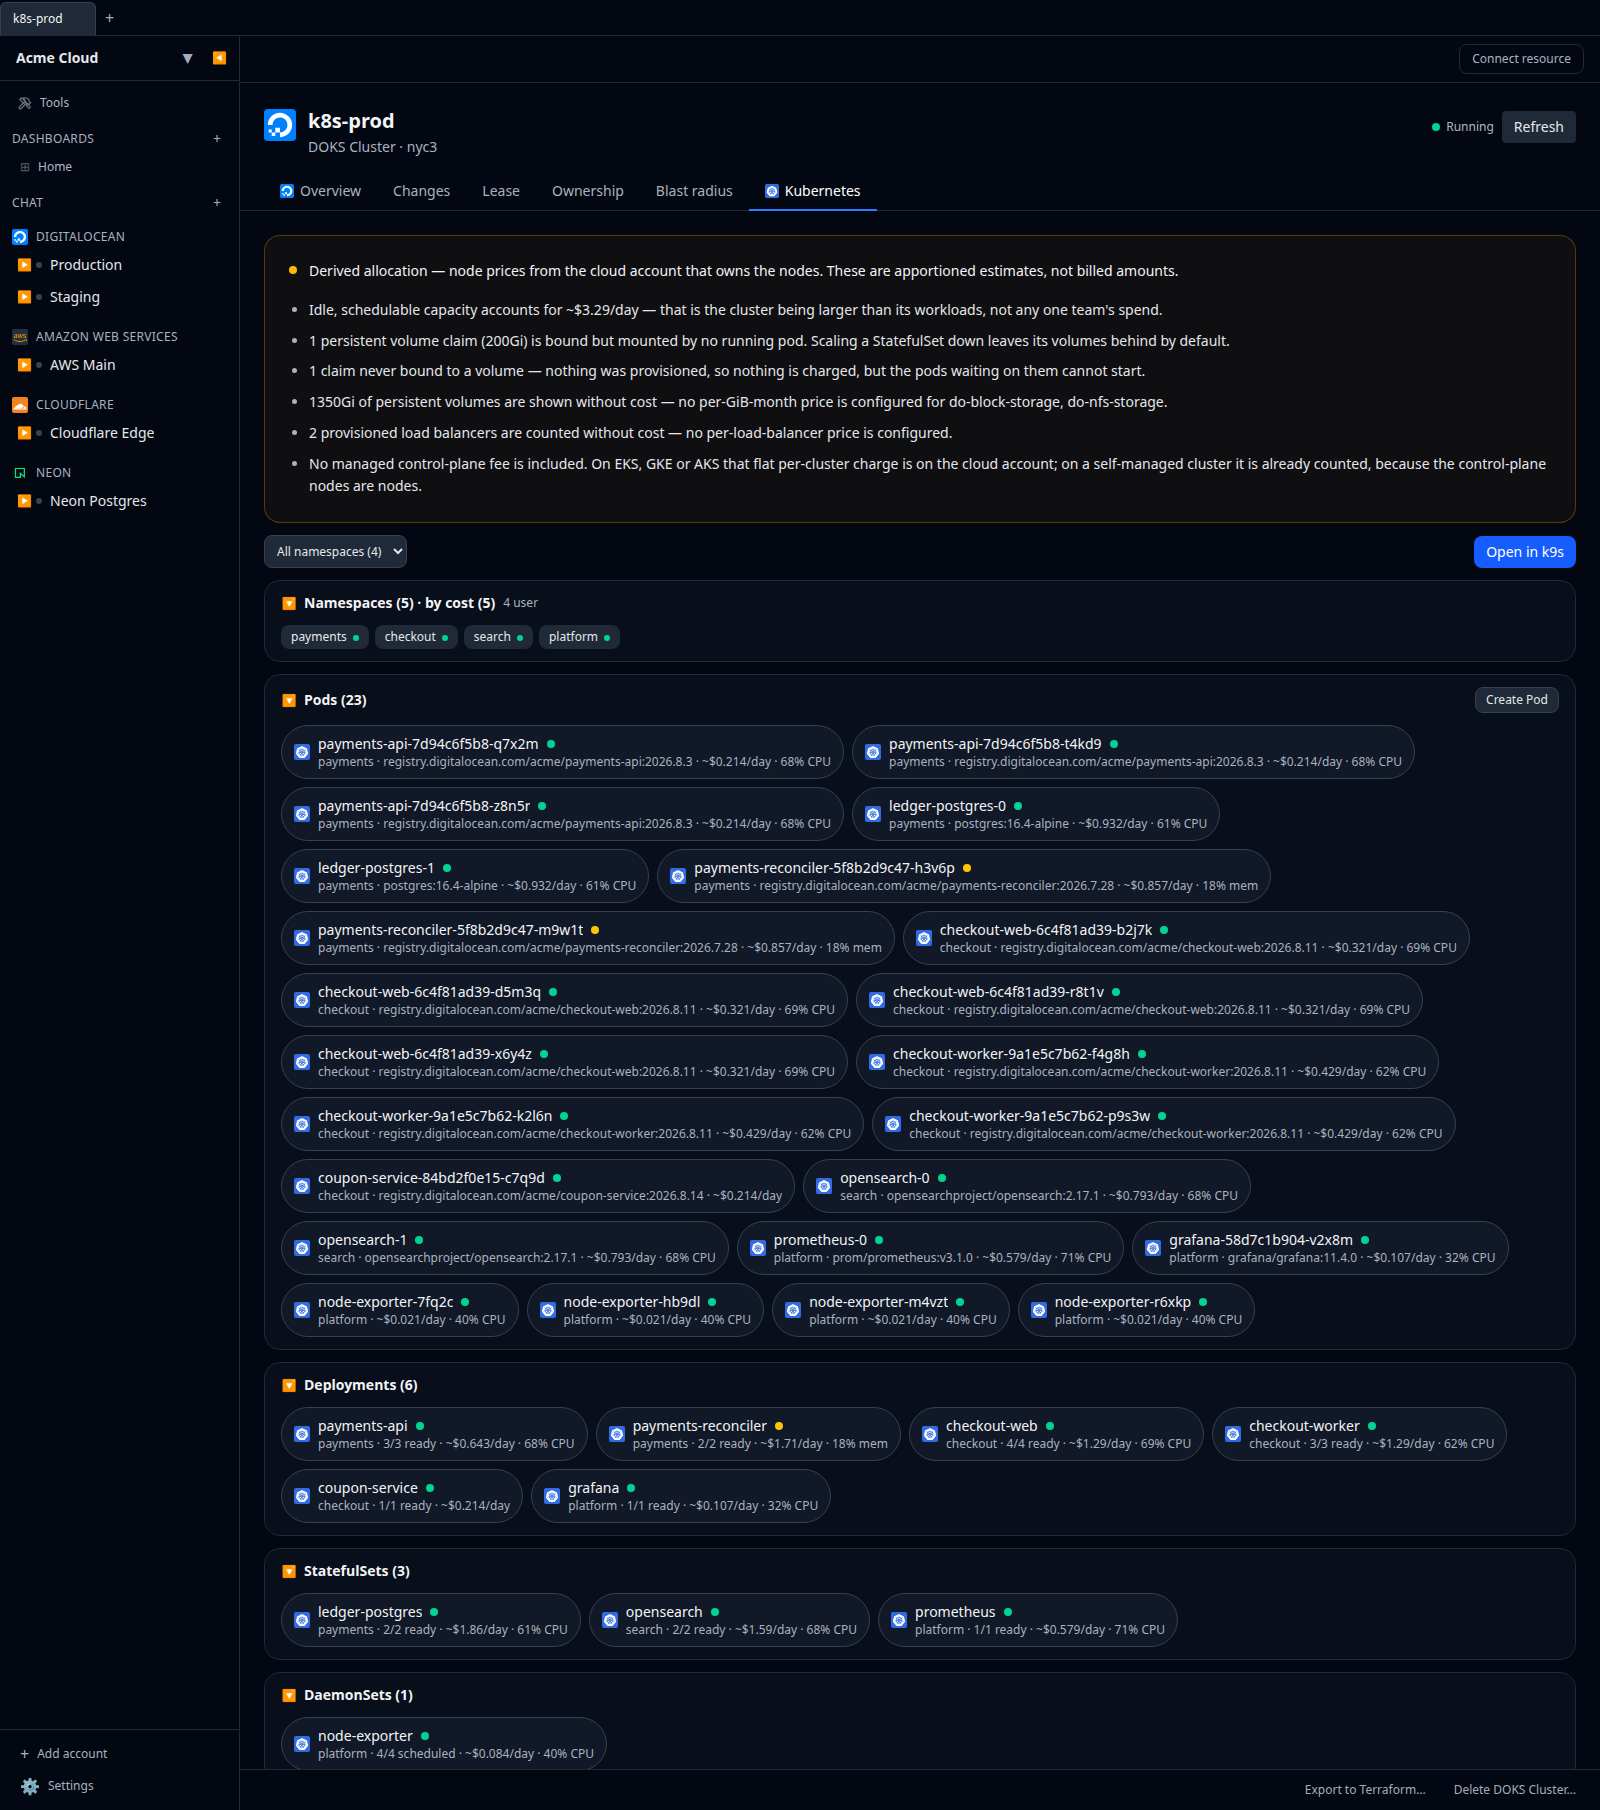
So Infrawrench derives it. Node capacity, times what that node costs per hour, times each pod’s share of it; plus each PersistentVolumeClaim charged to the workload that mounts it; plus each LoadBalancer Service charged to the workload behind its selector; plus the flat managed-cluster fee in a bucket of its own. All rolled up by workload and namespace. The result appears wherever the cluster already appears: in the Kubernetes pane on your DOKS/GKE/EKS/AKS/Kapsule/Managed Kubernetes cluster, on the resource cards, on the detail views, on the new Efficiency tab, and on the cluster’s own Metrics tab.
These are derived allocations, not billed amounts. Nobody invoices you per namespace. Everything on this page is the node bill, re-cut. Do not add a Kubernetes account’s numbers to its parent cloud account’s numbers — that double-counts the same money.
What it needs
| Input | Where it comes from | Without it |
|---|---|---|
| Node capacity and pod requests | The Kubernetes API. Always available. | Nothing works; this is the baseline. |
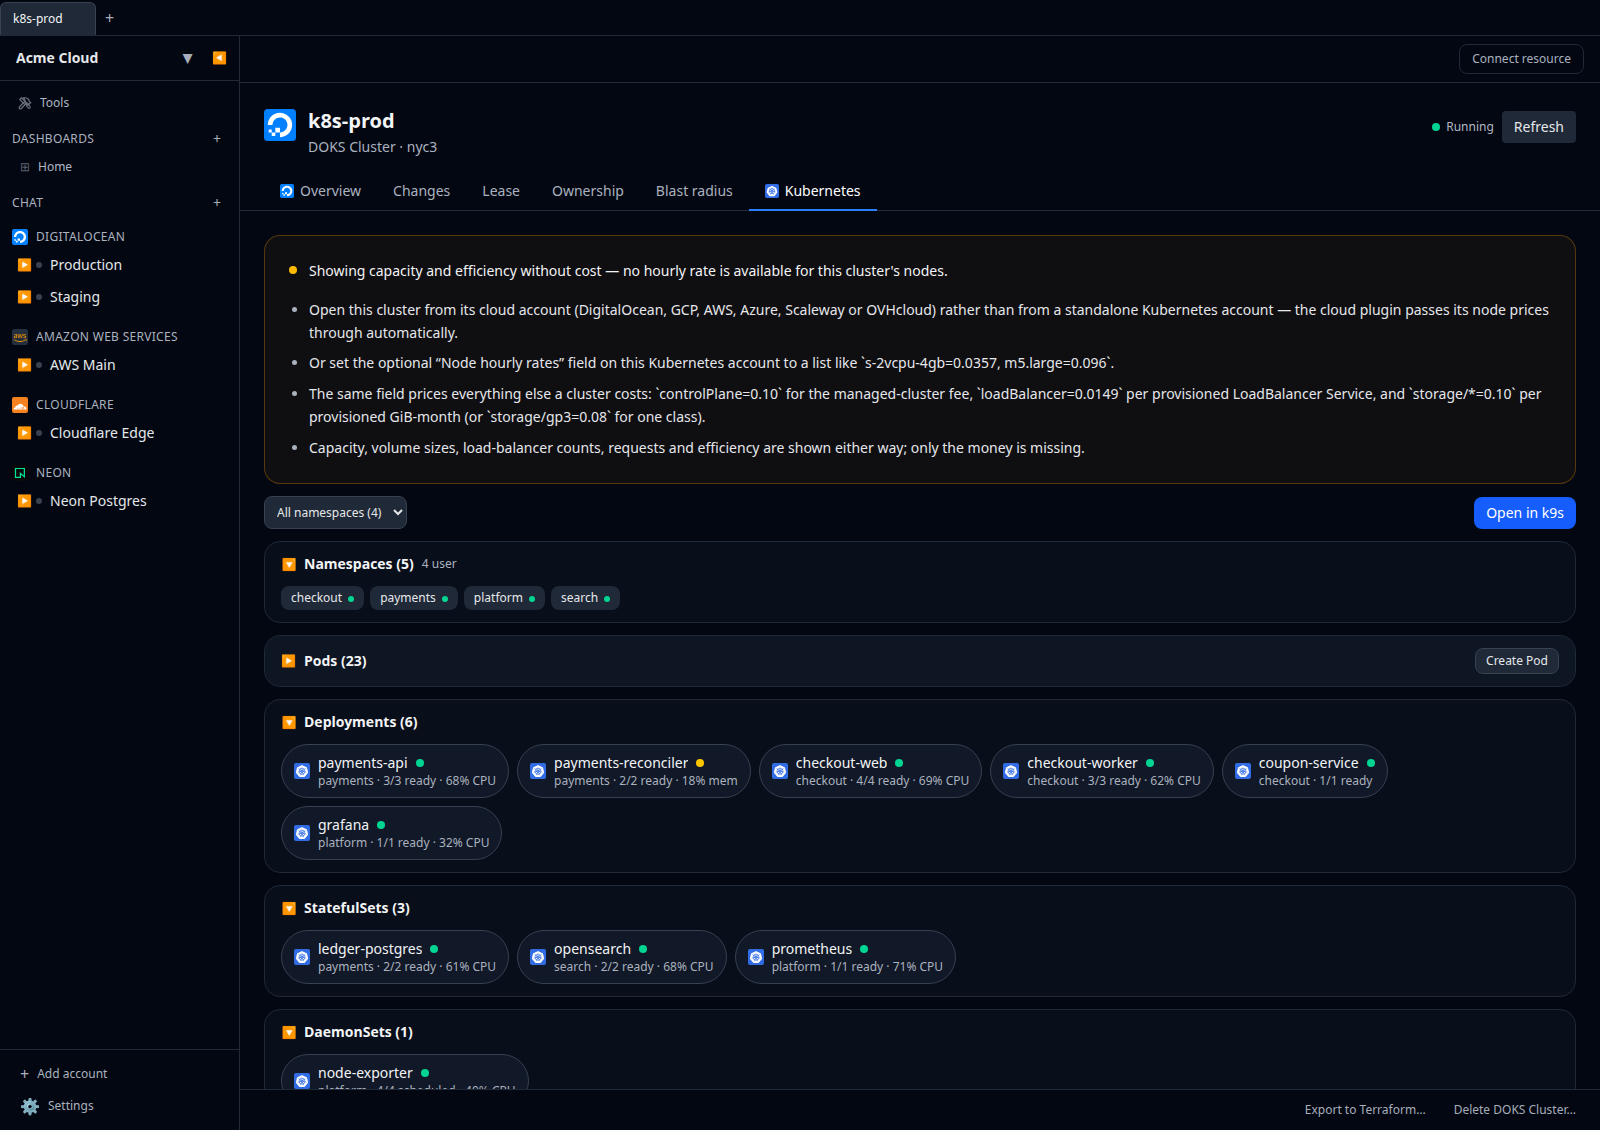
| A per-node hourly price | The parent cloud plugin, or the optional field on the account. | Capacity and requests are still shown — the money is omitted. |
| Live CPU/memory usage | metrics.k8s.io, served by metrics-server. | Allocation falls back to requests alone. Efficiency reads unknown. |
| PersistentVolumeClaims | /api/v1/persistentvolumeclaims. Optional RBAC. | Storage is reported as unavailable, not as zero. |
LoadBalancer Services | /api/v1/services. Optional RBAC. | Load balancers are reported as unavailable, not as zero. |
| Per-GiB-month and per-LB prices | The optional rates field (see below). | Volume sizes and load-balancer counts are shown with no money attached. |
| The managed control-plane fee | The optional rates field. | No control-plane bucket. A self-managed cluster genuinely has none. |
A kubeconfig that may list pods but not PVCs still gets the complete compute allocation. Nothing about the new components is allowed to break what already worked.
metrics-server is optional
Live utilization comes from the metrics.k8s.io/v1beta1 aggregated API, which is served by metrics-server. It ships preinstalled on GKE, EKS, AKS and DOKS, but is genuinely absent on plenty of clusters — bare kubeadm, kind, k3s without the bundled chart.
Its absence never breaks anything. The pane notes it and falls back to requests-based allocation:
- Not installed — the API was never registered. You get costs, but no efficiency figures and no “this workload is over-requested” flags.
- Registered but unreachable — metrics-server is crash-looping or blocked from the control plane. Worth fixing; the pane says so specifically rather than lumping it in with “not installed”.
- Not permitted — your kubeconfig cannot read
metrics.k8s.io. An RBAC fix, not a cluster fix.
Install metrics-server and the numbers get sharper on the next refresh. Nothing needs reconfiguring.
Where the node price comes from
Two sources, in order.
1. The cloud account that owns the nodes. When you open the Kubernetes pane from a managed cluster resource, the cloud plugin hands its node prices to the Kubernetes plugin along with the kubeconfig. What it can supply varies:
| Provider | What it supplies | Quality |
|---|---|---|
| DigitalOcean | The published hourly price of each node pool’s Droplet size — which is what DOKS worker nodes are actually billed at. | Real price |
| AWS | On-demand hourly price of the managed node groups’ instance types. | List price |
| Azure | Retail pay-as-you-go hourly price of the cluster’s node VM size. | List price |
| GCP | Not yet — see Limitations. | None |
| Scaleway | Not yet. | None |
| OVHcloud | Not yet. | None |
List prices are exactly that: Savings Plans, Reserved Instances, committed-use discounts and Spot all move the real number, usually downward. The pane says which kind of price it used.
2. Rates you supply. A standalone Kubernetes account — one you added by pasting a kubeconfig, with no cloud account behind it — has an optional Cluster hourly rates field. List instance types and their hourly cost:
s-2vcpu-4gb=0.0357, m5.large=0.096The instance type is matched against each node’s node.kubernetes.io/instance-type label.
The same field prices everything else the cluster costs, using reserved keys:
| Key | Means | Example |
|---|---|---|
controlPlane | The flat managed-cluster fee, per hour. | controlPlane=0.10 |
loadBalancer | Per provisioned LoadBalancer Service, per hour. | loadBalancer=0.0149 |
loadBalancer/<ns>/<name> | One specific Service. Overrides the flat rate, including with 0. | loadBalancer/kube-system/metallb-demo=0 |
storage/<class> | Per provisioned GiB-month for one StorageClass. | storage/gp3=0.08 |
storage/* | Per provisioned GiB-month for any class not named above. | storage/*=0.10 |
s-2vcpu-4gb=0.0357, m5.large=0.096
controlPlane=0.10, loadBalancer=0.0149, storage/*=0.10
Everything here is optional and independent. Fill in only the node prices and you get exactly what you got before; add storage/* and the volumes acquire a price without anything else changing.
If a price is not available, none is invented. You get capacity, volume sizes, load-balancer counts, requests, and (with metrics-server) efficiency, and the pane explains what to do about the missing money. A fabricated number is worse than no number, because it gets believed.
How attribution works
The node’s price is split between CPU and memory
A node is one price for two resources, so the price has to be divided before a pod’s share of it means anything. Infrawrench splits it 65% CPU / 35% memory.
That is not a round number picked for tidiness. Cloud providers that publish component pricing charge separately per vCPU-hour and per GiB-hour, and a general-purpose instance’s price is the sum. Taking those published rates for the mainstream general-purpose families — which run at roughly 4 GiB of RAM per vCPU — the CPU term is consistently a little under two thirds of the machine price. GCP’s N2 family in us-central1, for instance, prices vCPUs at $0.031611/hour and RAM at $0.004237/GiB-hour; for an n2-standard-4 that is $0.126 of CPU against $0.068 of RAM, a 65% CPU share.
The split only moves money between tenants sharing a node. It never changes the cluster total, the idle bucket, or any efficiency figure — so a few points of error is not load-bearing.
A pod is charged the greater of its request and its usage
Not the request. Not the usage. The larger of the two, per dimension.
- A pod that under-requests and then eats the machine is still consuming it. Charging its request would let a
BestEffortpod monopolise a node for free. - A pod that requests generously and idles has denied that capacity to everyone else. Charging its usage would make hoarding free.
Charging the greater of the two is the only rule that is fair in both directions. Where there is no utilization data the rule degrades to requests alone, and the pane says so.
Pod requests use the real Kubernetes rules, not a naive sum of containers: init containers are compared as a peak rather than added, sidecars (init containers with restartPolicy: Always) count toward both the init peak and the steady state, pod-level resources override the container aggregate, and pod overhead is added on top.
Idle capacity is its own line
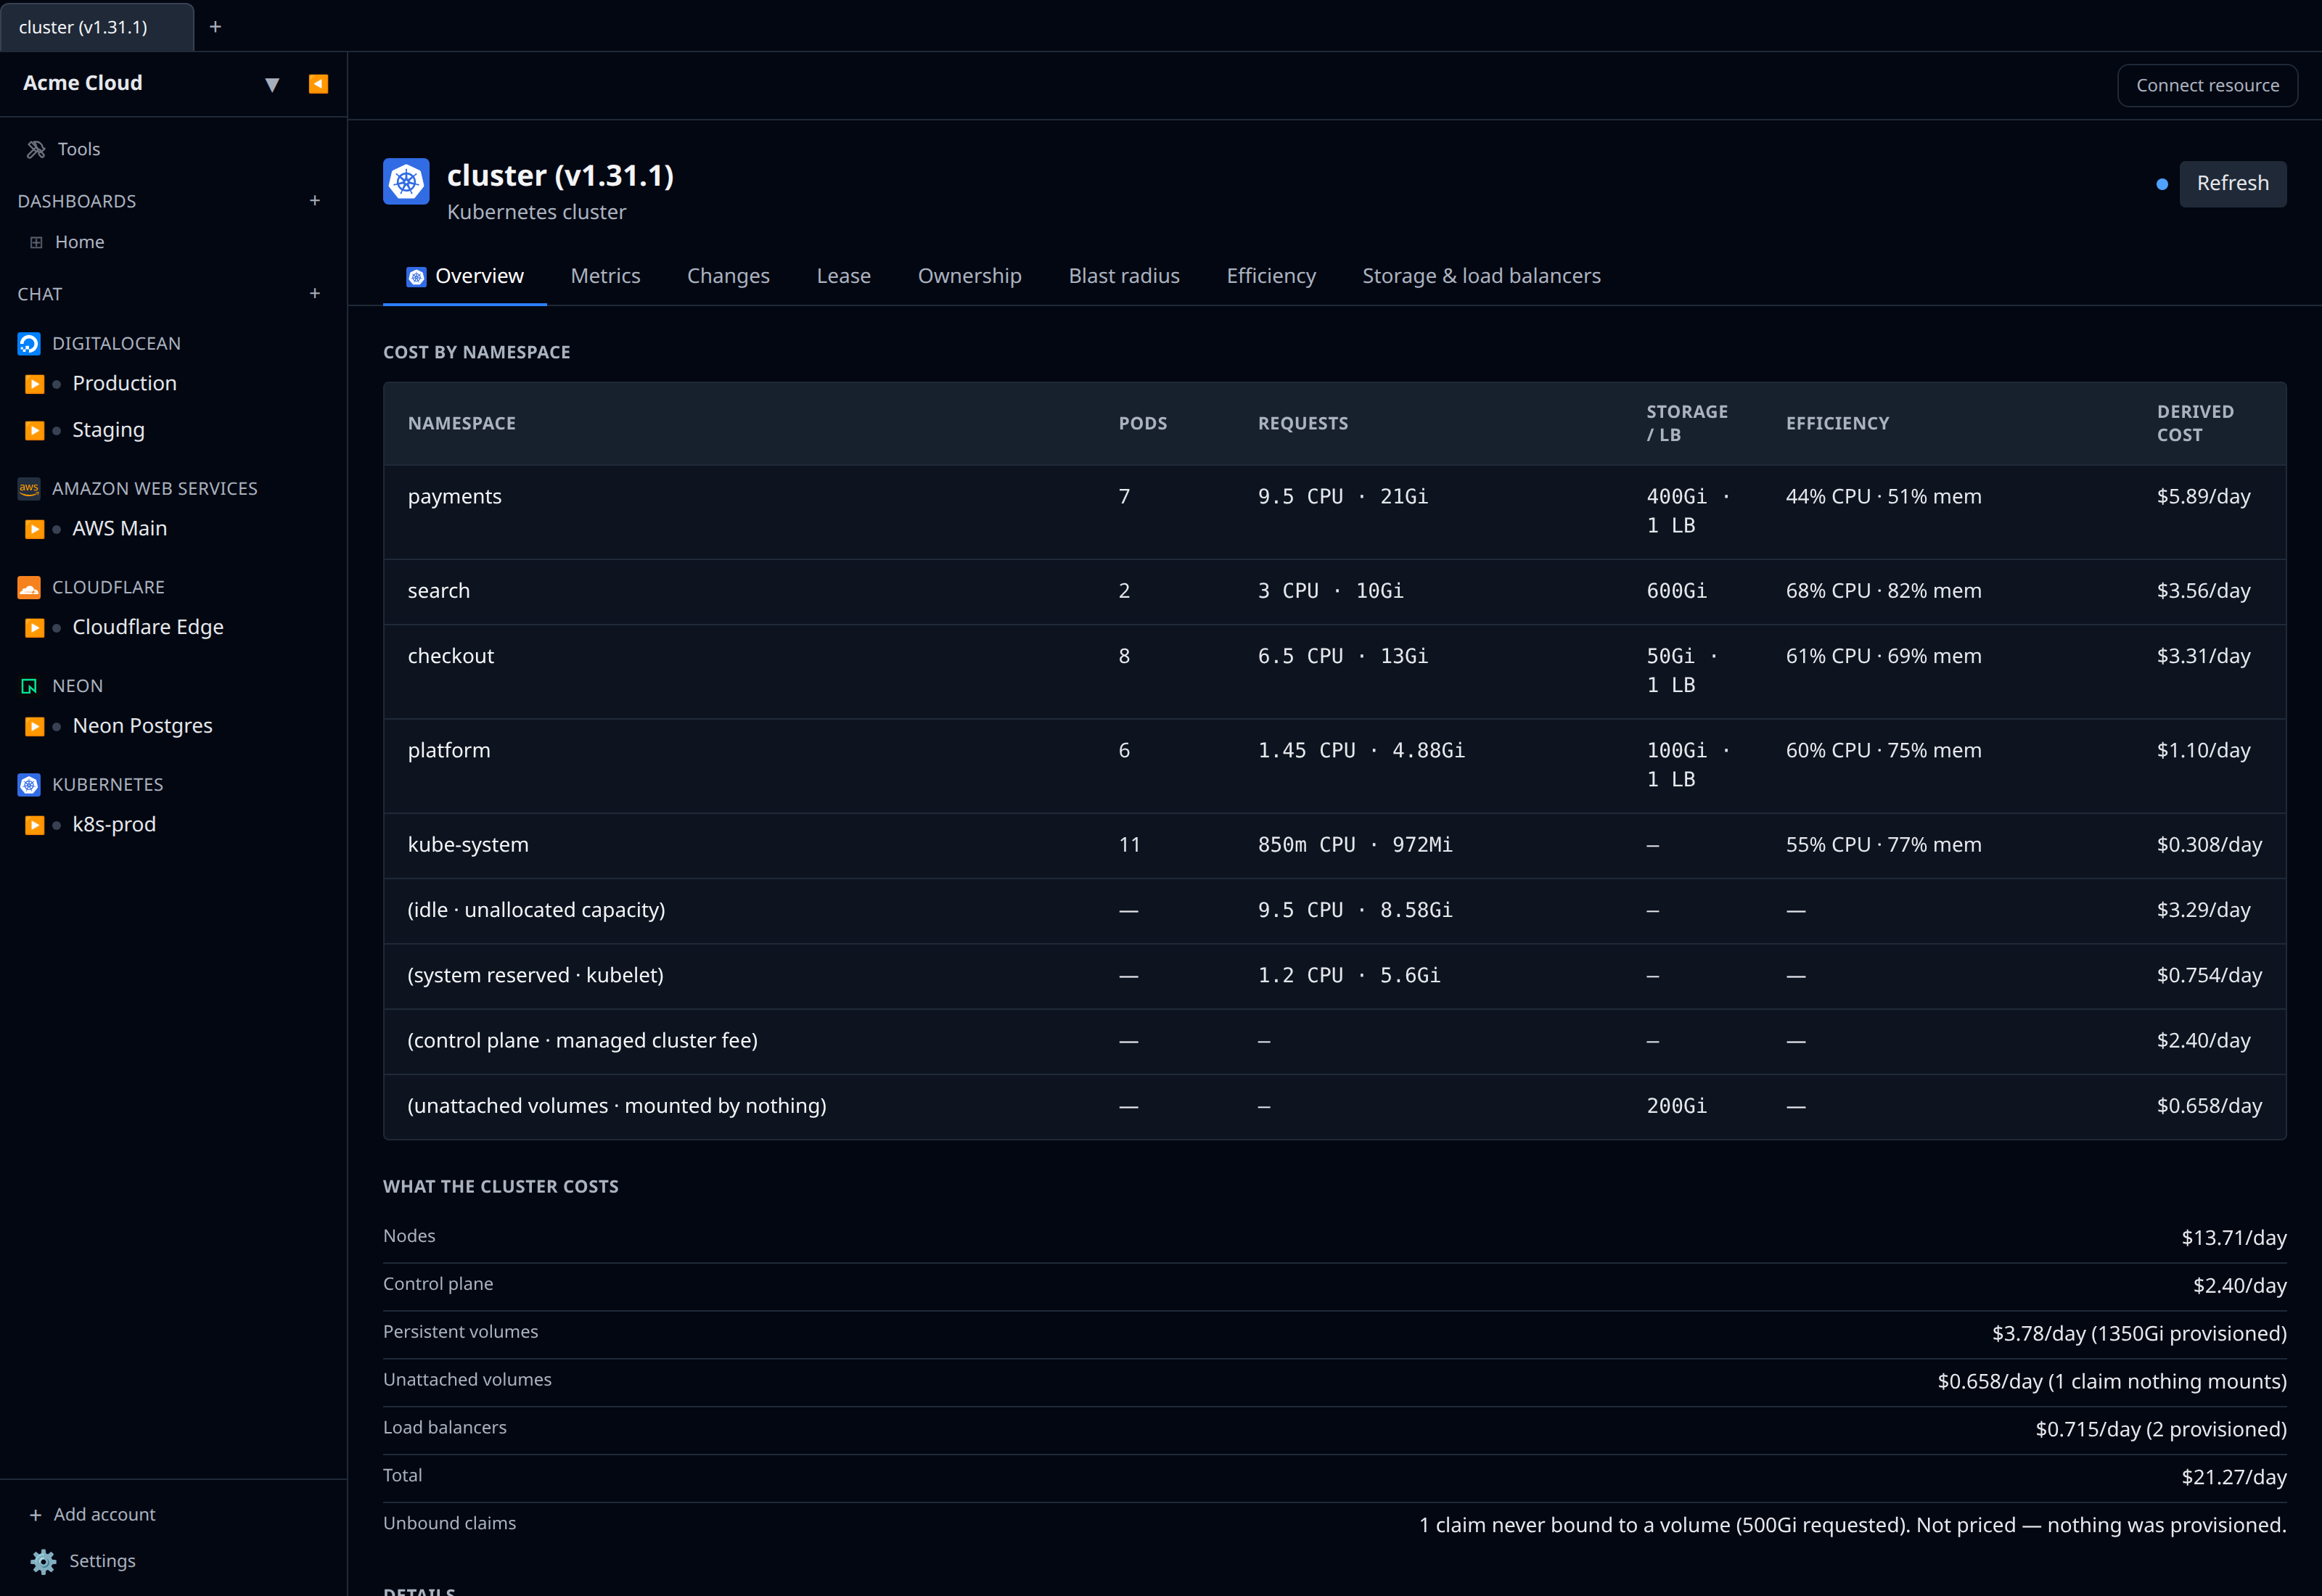
Whatever the workloads on a node do not hold is reported separately, in two buckets:
- Idle — schedulable capacity nobody asked for. This is the cluster being bigger than its workloads.
- System reserved — the gap between the node’s capacity and its allocatable, which the kubelet keeps for itself. Never any workload’s fault.
Neither is spread across the namespaces. Doing that would overcharge every tenant and hide the actual finding, which is that you are paying for a cluster larger than what you run on it. A cluster where half the money is in the idle row is telling you something specific, and it is not “the payments namespace is expensive”.
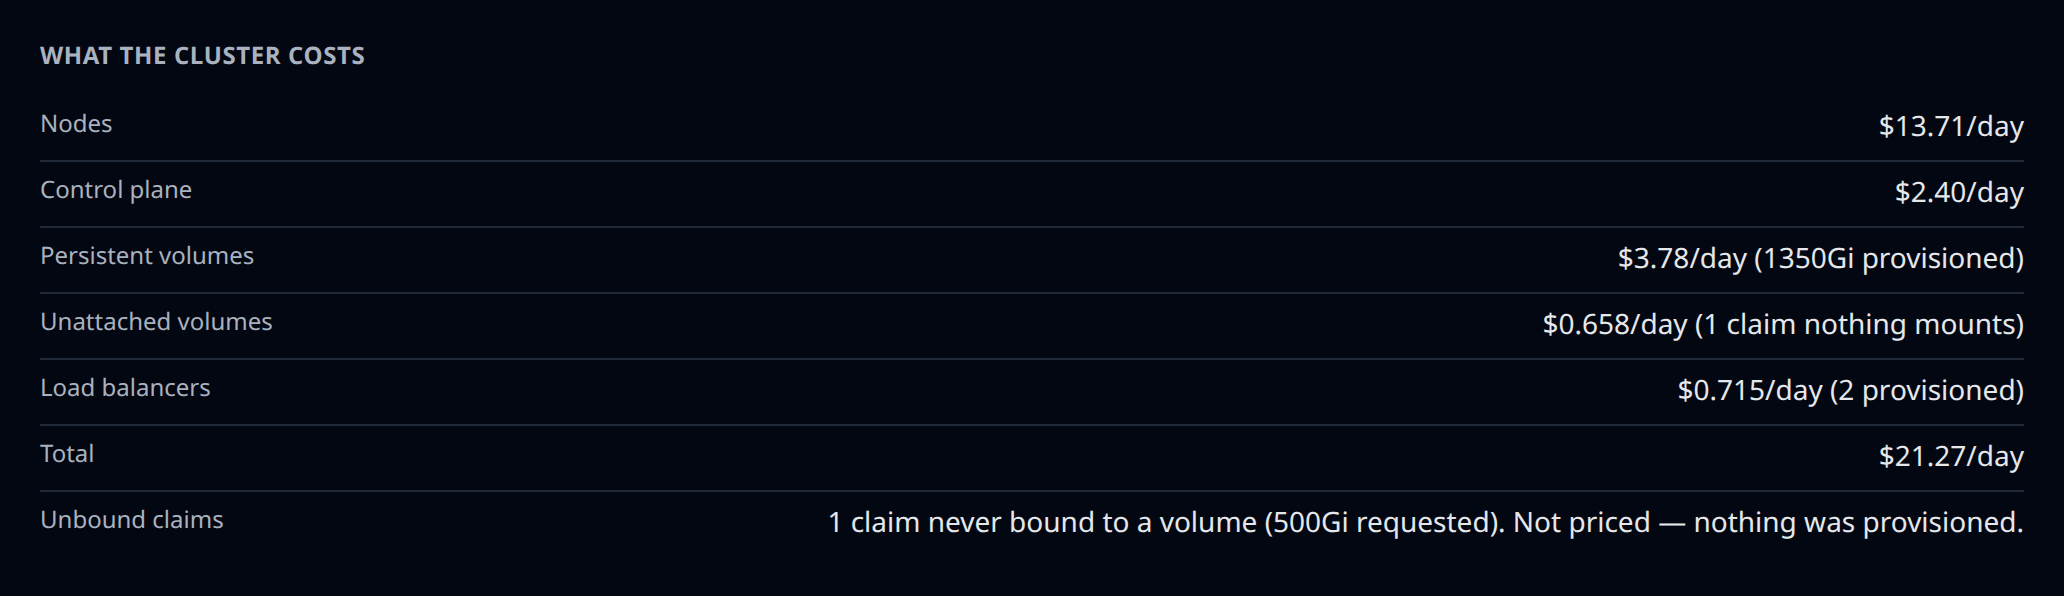
Two more buckets join them for the same reason: the control-plane fee and unattached volumes. All four sit at the bottom of the cluster’s cost table, labelled as capacity rather than as anyone’s spend.
Efficiency is used ÷ requested
Reported per workload for CPU and memory. A workload using under 20% of what it reserved on both dimensions is flagged as over-requested — its pill turns amber and its efficiency stat goes degraded.
Both dimensions have to be low. A workload using 5% of its CPU but 90% of its memory is correctly sized for memory, and shrinking it would break it.
Efficiency only appears when metrics-server does. Requests alone say nothing about waste — so a workload nothing measured reads unknown, never 0%.
Beyond node compute
A cluster’s bill is not only machines. Three more things are attributed, each by the tightest honest scope.
Persistent volumes
A PersistentVolumeClaim is namespaced and is mounted by pods, which makes it genuinely attributable. Infrawrench reads every claim and follows spec.volumes[].persistentVolumeClaim.claimName on the running pods back to the workload that owns them.
| Situation | Charged to |
|---|---|
| Exactly one workload mounts the claim | That workload. |
| Several workloads mount it (RWX) | The namespace. Splitting one shared disk N ways would be invented. |
| Bound, but no running pod mounts it | Its own bucket — see below. |
Never bound (Pending, Lost) | Nobody. It is counted and reported, and never priced. |
The size charged is status.capacity.storage — what the provisioner actually made — and not the request, because providers round up to their own minimums and the bill follows what exists. A claim that has not bound yet has no provisioned size, so its request is shown and labelled as a request.
Storage is priced per provisioned GiB-month. That is how block storage bills: you pay for the disk you asked for, not the bytes you wrote to it. The monthly rate is converted at 730 hours, the same conversion every major provider’s own calculator uses.
Volumes nothing mounts are their own waste finding, not a tenant’s cost. They get a bucket beside idle capacity rather than being added to their namespace’s total — but the row keeps its namespace tag, because whoever has to run kubectl delete pvc needs to know where.
The usual cause is invisible unless you know to look for it. A StatefulSet’s volumeClaimTemplates PVCs default to Retain on both scale-down and delete, so shrinking a StatefulSet from five replicas to two leaves three disks behind, billing, indefinitely. Deleting the StatefulSet entirely leaves all five.
Load balancers
A Service of type LoadBalancer provisions a real cloud load balancer with a real price. Its spec.selector is matched against pod labels to find the workload behind it.
Services take equality-based selectors only — a plain map, never matchExpressions — so the match is exact rather than approximate. Where it resolves to a single workload, the load balancer is charged there; where it resolves to several (a canary or blue/green pair sharing one Service) or to none, it is charged to the namespace instead.
A Service with no address in status.loadBalancer.ingress has not finished provisioning. It is counted, so a stuck one is visible, but not charged — there is nothing yet to be billed for.
spec.loadBalancerClass is reported but never used to decide a price. A non-default class might be an in-cluster implementation that costs nothing (MetalLB, kube-vip) or a cloud controller that costs plenty (the AWS Load Balancer Controller), and only you know which. Use a per-Service rate of 0 to exclude one.
The control plane
Every managed offering charges a flat per-cluster fee, and all three of the big ones charge the same shape of thing: EKS is “$0.10 per cluster per hour” on standard support and $0.60 on extended, GKE charges “a flat cluster management fee of $0.10 per cluster per hour … irrespective of the mode of operation, cluster size, or topology”, and AKS’s Standard tier is $0.10 per cluster per hour.
It is not attributable to a workload at all. It is the same number for a cluster running one pod as for one running ten thousand — there is no per-workload quantity to divide it by even if you wanted to. So it gets its own bucket beside idle and system-reserved, and is never spread across tenants.
A self-managed cluster has no such fee, and correctly gets no bucket: its control plane runs on nodes that are already in /api/v1/nodes and already priced as compute. Adding a fee there would count the same machines twice.
Egress is not allocated, and will not be guessed
The Kubernetes API exposes no per-workload byte counters. metrics.k8s.io carries a ResourceList of CPU and memory and nothing else, and there is no other source inside the cluster API for how much traffic a namespace sent.
Per-workload egress therefore needs a flow-log source outside the cluster API — a CNI that records it (Cilium’s Hubble, Calico), or the cloud’s own VPC flow logs. Until one of those is wired in, Infrawrench reports no egress figure rather than dividing the cluster’s network bill by pod count, or by CPU share, or by any other proxy that would look precise and be wrong.
The efficiency report
Efficiency used to be a percentage on a pill. It is now a report you can open, share and act on: an Efficiency tab on the cluster and on every namespace.
It shows, per namespace and per workload: what was requested, what is actually used, the CPU and memory ratios, what the unused portion costs, and the total attributed cost. Worst offenders first.
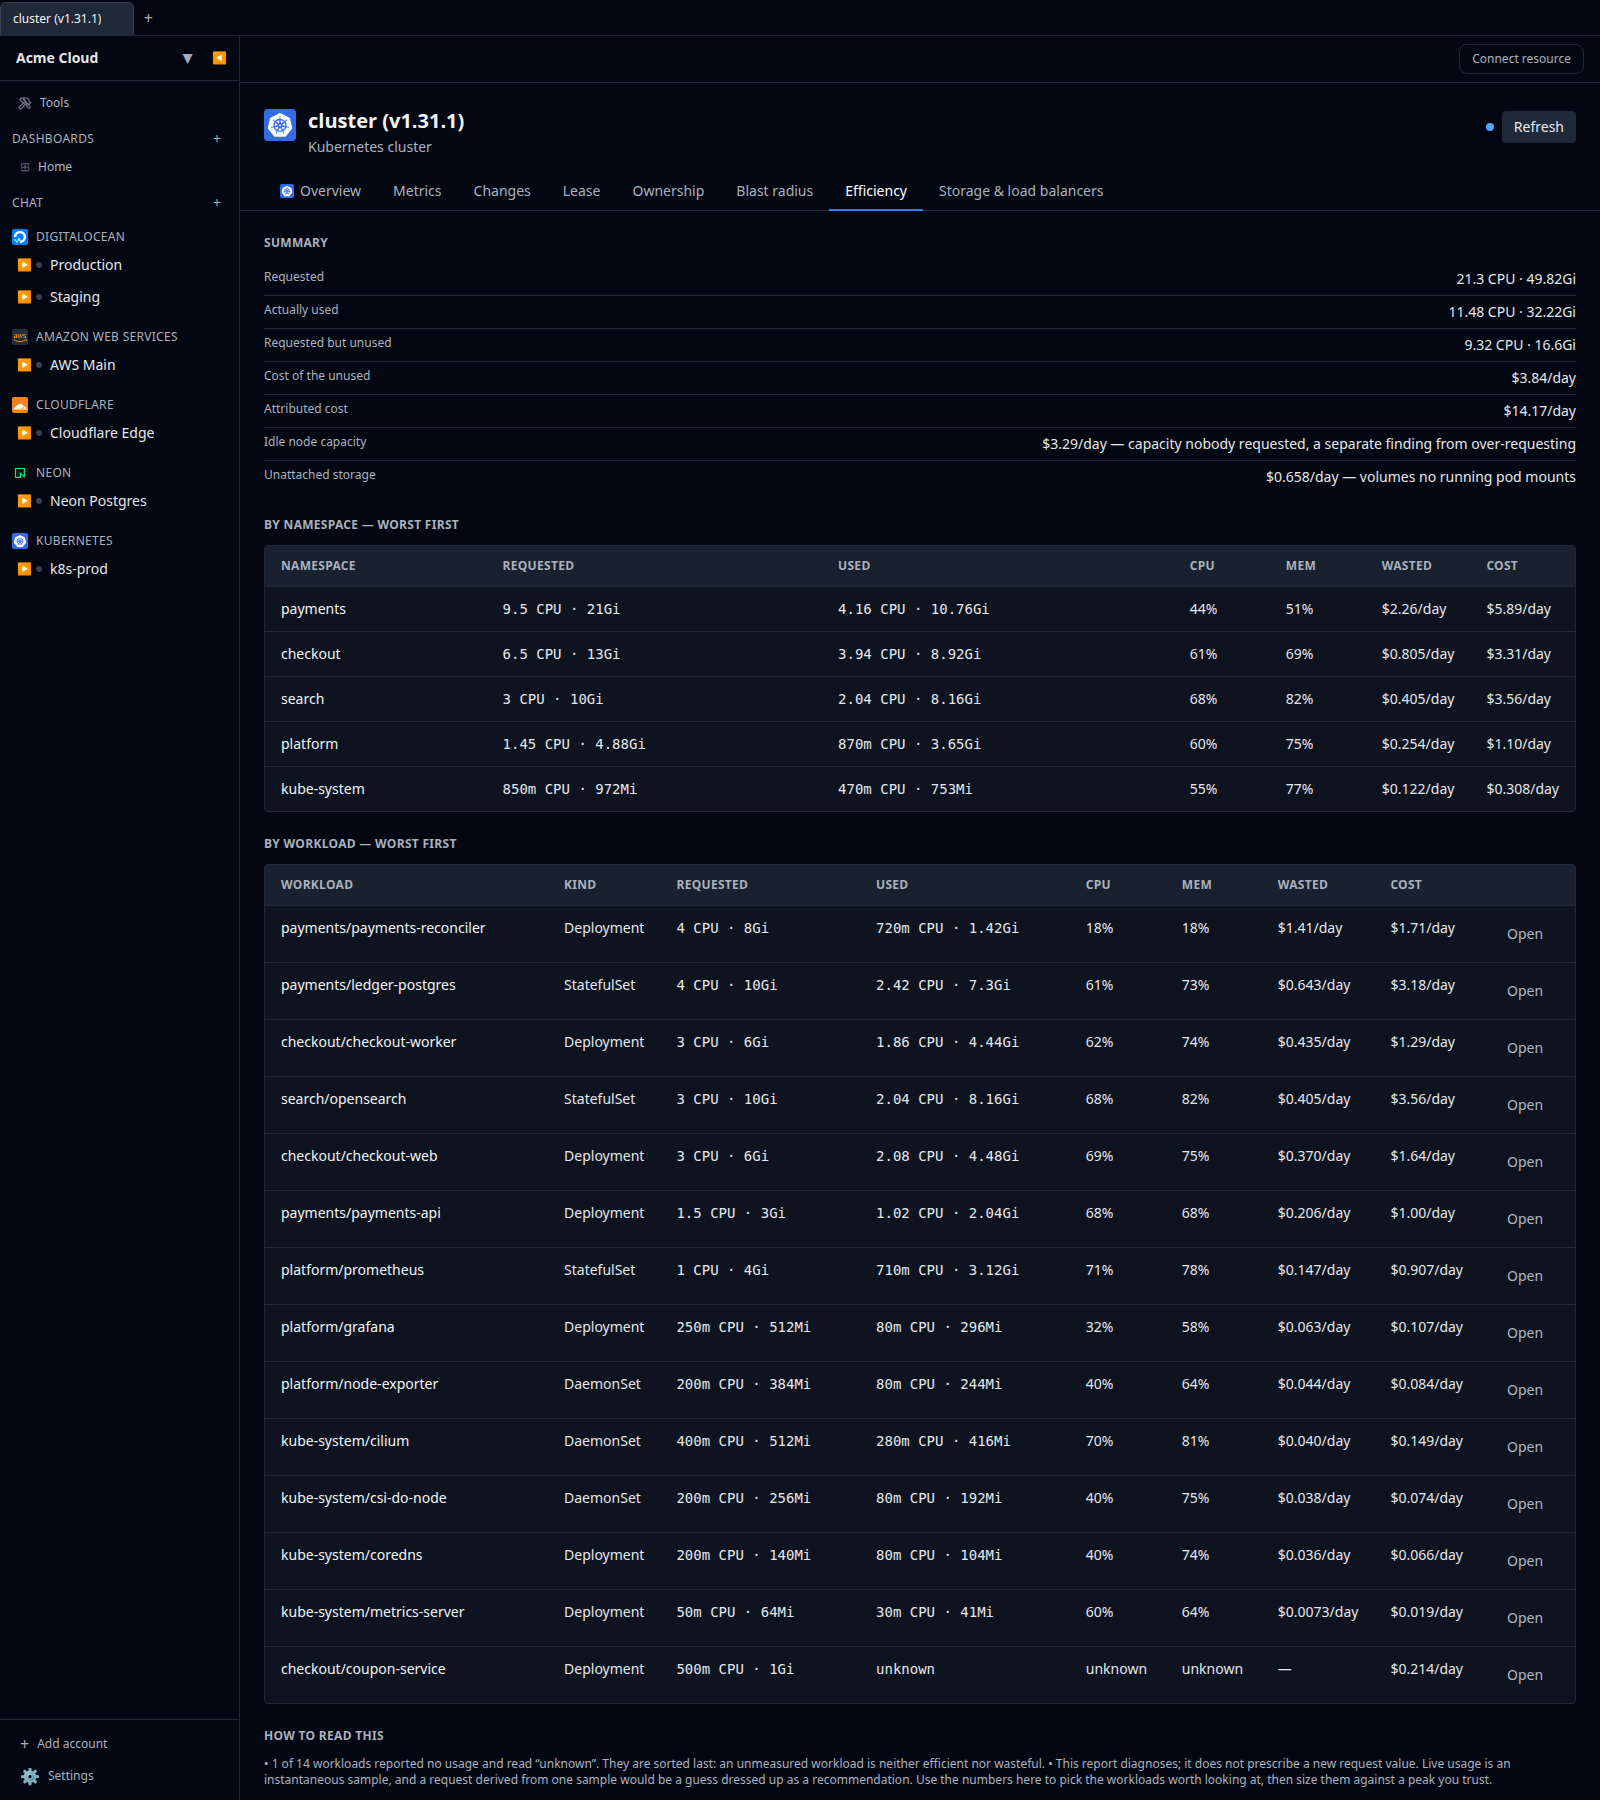
The money is the point. The percentage is the diagnosis; the money is the argument. Nobody schedules an afternoon of work off a ratio, so the ordering is by cost of waste, not by percentage — a workload at 4% efficiency on a tiny request matters less than one at 40% on half a node, and sorting by ratio would put them the wrong way round.
Ordering, precisely. Three tiers, because they are not comparable:
- Rows with a priced waste figure, most expensive first. This is the list you act on.
- Rows that were measured but sit on a node with no hourly rate — ranked by wasted CPU cores, the biggest thing they can honestly be compared by.
- Rows nothing measured, alphabetically, at the bottom.
A workload with no usage data reads unknown, not 0%. This matters more than it sounds. If an unmeasured workload rendered as 0% efficient, then the day your metrics-server crash-looped, every workload in the cluster would appear to be wasting everything — a cluster-wide emergency that is actually a monitoring outage. Unknown is a different claim from zero, and the report keeps them apart everywhere: the ratio cells, the used column, the wasted column, and the sort order.
Three kinds of waste, kept separate. The summary states them side by side because they have different fixes:
- Requested but unused — workloads holding capacity they do not touch. Fixed by editing
resources.requests. - Idle node capacity — capacity nobody requested at all. Fixed by shrinking the cluster, not by editing any workload.
- Unattached volumes — disks no running pod mounts. Fixed by deleting them.
Folding any of them into another would hide all three.
Sharing it
The tab ends with a Share block: the whole report as fixed-width text, with a copy button. Figures, caveats and the timestamp travel together, so it can be pasted into a ticket or a Slack thread without a screenshot that goes stale without saying so.
Each workload row also carries an Open link straight to that Deployment, StatefulSet or DaemonSet.
Why it is not a saved cost report
Saved cost reports are saved queries over stored cost rows — a chart config, run against the daily cost warehouse, rendered as one money-over-time card. The numbers this report is about (requested, used, wasted CPU and memory) are computed live from the cluster API and are never written to that warehouse; only the money is. There is no report-kind discriminator to extend and no per-row usage columns to query, so it lives where its data lives: on the cluster.
The cost side of the allocation still lands in the cost warehouse as usual, so cluster spend charts and budgets like any other provider’s.
Right-sizing: what this does and does not do
Infrawrench’s right-sizing finds oversized VMs: it takes a p95 over 14 days of stored metrics and matches it against the provider’s catalog of discrete instance sizes with live prices, then applies the resize through the resource’s normal update path.
A Kubernetes recommendation is deliberately not added there, and this report deliberately stops short of naming a new request value. Every piece of the VM machinery is wrong for a workload:
- There is no catalog. A pod request is a continuous, two-dimensional quantity set per container, not a choice from a menu — there is no “next size down”.
- There is no update path. Resizing a workload is a patch to
spec.template.spec.containers[].resources, which is the manifest editor’s job. - There is no p95.
metrics.k8s.ioreports usage over a window of seconds. A “recommended request” derived from a single instantaneous sample is exactly the confident-looking invented number the rest of this feature refuses to produce — a workload’s 03:00 sample does not describe its lunchtime peak.
So the report gives you the argument, not the answer: the money, the ratio, and the worst offenders in order. Deciding the new number is yours to make, against a workload whose shape you know.
System namespaces are included
The workload listings hide kube-system, kube-public, and the provider-managed namespaces, because someone browsing their own workloads does not want to wade through them.
Cost allocation deliberately does not inherit that. Those pods sit on the same nodes and hold real capacity. Dropping them would make their spend vanish and make every other namespace look proportionally larger than it is. They appear in the tables and in the cost rows, tagged system=true so you can filter them out yourself if you want to.
The Namespaces group in the Kubernetes pane follows the listings, not the allocation — it is a filter over the workloads the pane shows, and there are no kube-system workloads to filter to. So system namespaces are neither offered there nor included in the group’s count: the number in Namespaces (5) · by cost is always the number of pills below it. Their money is on the Cost by namespace table and the Efficiency tab, where nothing is hidden.
Where it shows up
- The Kubernetes pane on your cloud cluster resource — a Namespaces group ordered by cost, and per-item cost and efficiency appended to every pod, deployment, statefulset, daemonset and namespace pill. A namespace pill reads
Active · ~$4.20/day · 18% CPU: the phase, the day’s allocated cost, and the tighter of its two efficiency figures. Its banner also flags unattached volumes, never-bound claims and unpriced components. - Resource cards — cost/day and efficiency stats for clusters, namespaces, pods, deployments, statefulsets and daemonsets. The cluster card also carries an Idle stat with its percentage (measured against node cost, not the whole bill), an Over-requested money figure, and Volumes / Load balancers counts.
- Detail views — a Cost by namespace table on the cluster with a Storage/LB column and the idle, system-reserved, control-plane and unattached-volume rows; a What the cluster costs per-component breakdown; and a Cost by workload table on each namespace.
- The Efficiency tab — on the cluster and on every namespace.
- The Storage & load balancers tab — every claim and every
LoadBalancerService, with what it is attributed to and what it costs. - Metrics tabs — cost, each component, waste and efficiency as time series.
- The cloud cluster’s own Metrics tab — the same cluster-level series are merged in next to the provider’s node metrics, so cluster spend sits beside cluster CPU rather than one tab deeper.
- Cost graphs and budgets — the allocation is written as daily cost rows, so it charts and budgets like any other spend.
In cost graphs
Kubernetes accounts collect a daily snapshot into the same store every other provider writes to, so the allocation is available to graphs, filters, budgets, and the infrawrench costs CLI.
The dimensions it reports:
| Dimension | Values |
|---|---|
| Service | One of the seven labels below |
| Resource | The object identity — namespace/Kind/name |
Tag namespace | The Kubernetes namespace |
Tag workload | The owning Deployment / StatefulSet / DaemonSet / Job name, where there is one |
Tag workload_kind | That owner’s kind |
Tag system | true for the control-plane namespaces |
The service labels partition the bill — every unit of money appears under exactly one, so they can be summed without double-counting:
| Service | Is |
|---|---|
kubernetes-workload | A workload’s share of node compute. |
kubernetes-storage | A PersistentVolumeClaim, attributed to its workload or its namespace. |
kubernetes-load-balancer | A LoadBalancer Service. |
kubernetes-idle | Schedulable node capacity nobody requested. |
kubernetes-system-reserved | Node capacity the kubelet keeps. |
kubernetes-storage-idle | A bound volume no running pod mounts. |
kubernetes-control-plane | The flat managed-cluster fee. |
Because they partition, a workload’s kubernetes-workload row carries its compute only — its disks and load balancers are separate rows under their own labels. Group by the namespace tag for a per-team view including storage; filter to kubernetes-workload alone for compute only; filter to kubernetes-storage-idle for a standing list of disks to delete.
There is no history to backfill. The Kubernetes API describes what is running right now, not what ran last Tuesday. Each daily collection appends one honest snapshot, and the series builds up from the day you connect the account. Unlike a provider that can restate a week of invoices, there is nothing here to restate.
Limitations
- GCP, Scaleway and OVHcloud supply no node price yet. GKE clusters show capacity and efficiency without money unless you fill in the rates field yourself. GCP’s Cloud Billing SKUs price vCPU-hours and GiB-hours separately rather than per machine type, so producing a per-node rate needs a machine-type → (vCPU, GiB) lookup that is not built yet.
- AWS and Azure prices are list prices. Commitments and Spot are not reflected, so a heavily-committed cluster will read high.
- No cloud plugin supplies the storage, load-balancer or control-plane prices automatically yet. They arrive through the same rates field, so a cluster opened from its cloud account gets node prices for free but needs
storage/*,loadBalancerandcontrolPlanefilled in by hand. Until they are, volumes and load balancers are shown as capacity and counts with no money. - Egress is not allocated at all, and is not guessed. See above.
- Volume utilisation is not measured. Storage is priced on what is provisioned, which is what is billed — but the cluster API cannot tell you how full a 500Gi disk is, so a mostly-empty volume is not flagged the way an over-requested workload is. The kubelet exposes that on its Prometheus endpoint, which is not part of the Kubernetes API.
- Volumes and load balancers do not appear as browsable resources. They are cost objects here, on the cluster’s tables and tabs, not entries in the sidebar with their own detail pages.
- A pod on a node that has since been drained is listed with its requests but carries no cost — there is no machine left to take the money from.
- Everything is still a snapshot. The cluster has no history, so each daily collection appends one honest day. A volume deleted this morning simply stops appearing tomorrow.