Quota & limit radar
Per-account provider quota utilisation, the trend that says whether it is getting closer, and an alert before a limit stops your next deploy.
Provider quotas are usually discovered mid-incident. The autoscaler stops scaling, a deploy
fails with VcpuLimitExceeded, a terraform apply halts on the fifth VPC — and only then
does anyone go looking for the number. The limit was knowable the whole time; nothing was
watching it.
The Quotas page watches it. Infrawrench reads each account’s quotas from its provider a few times a day, records a snapshot every time, and shows you how close you are, which way it is moving, and roughly when you run out.
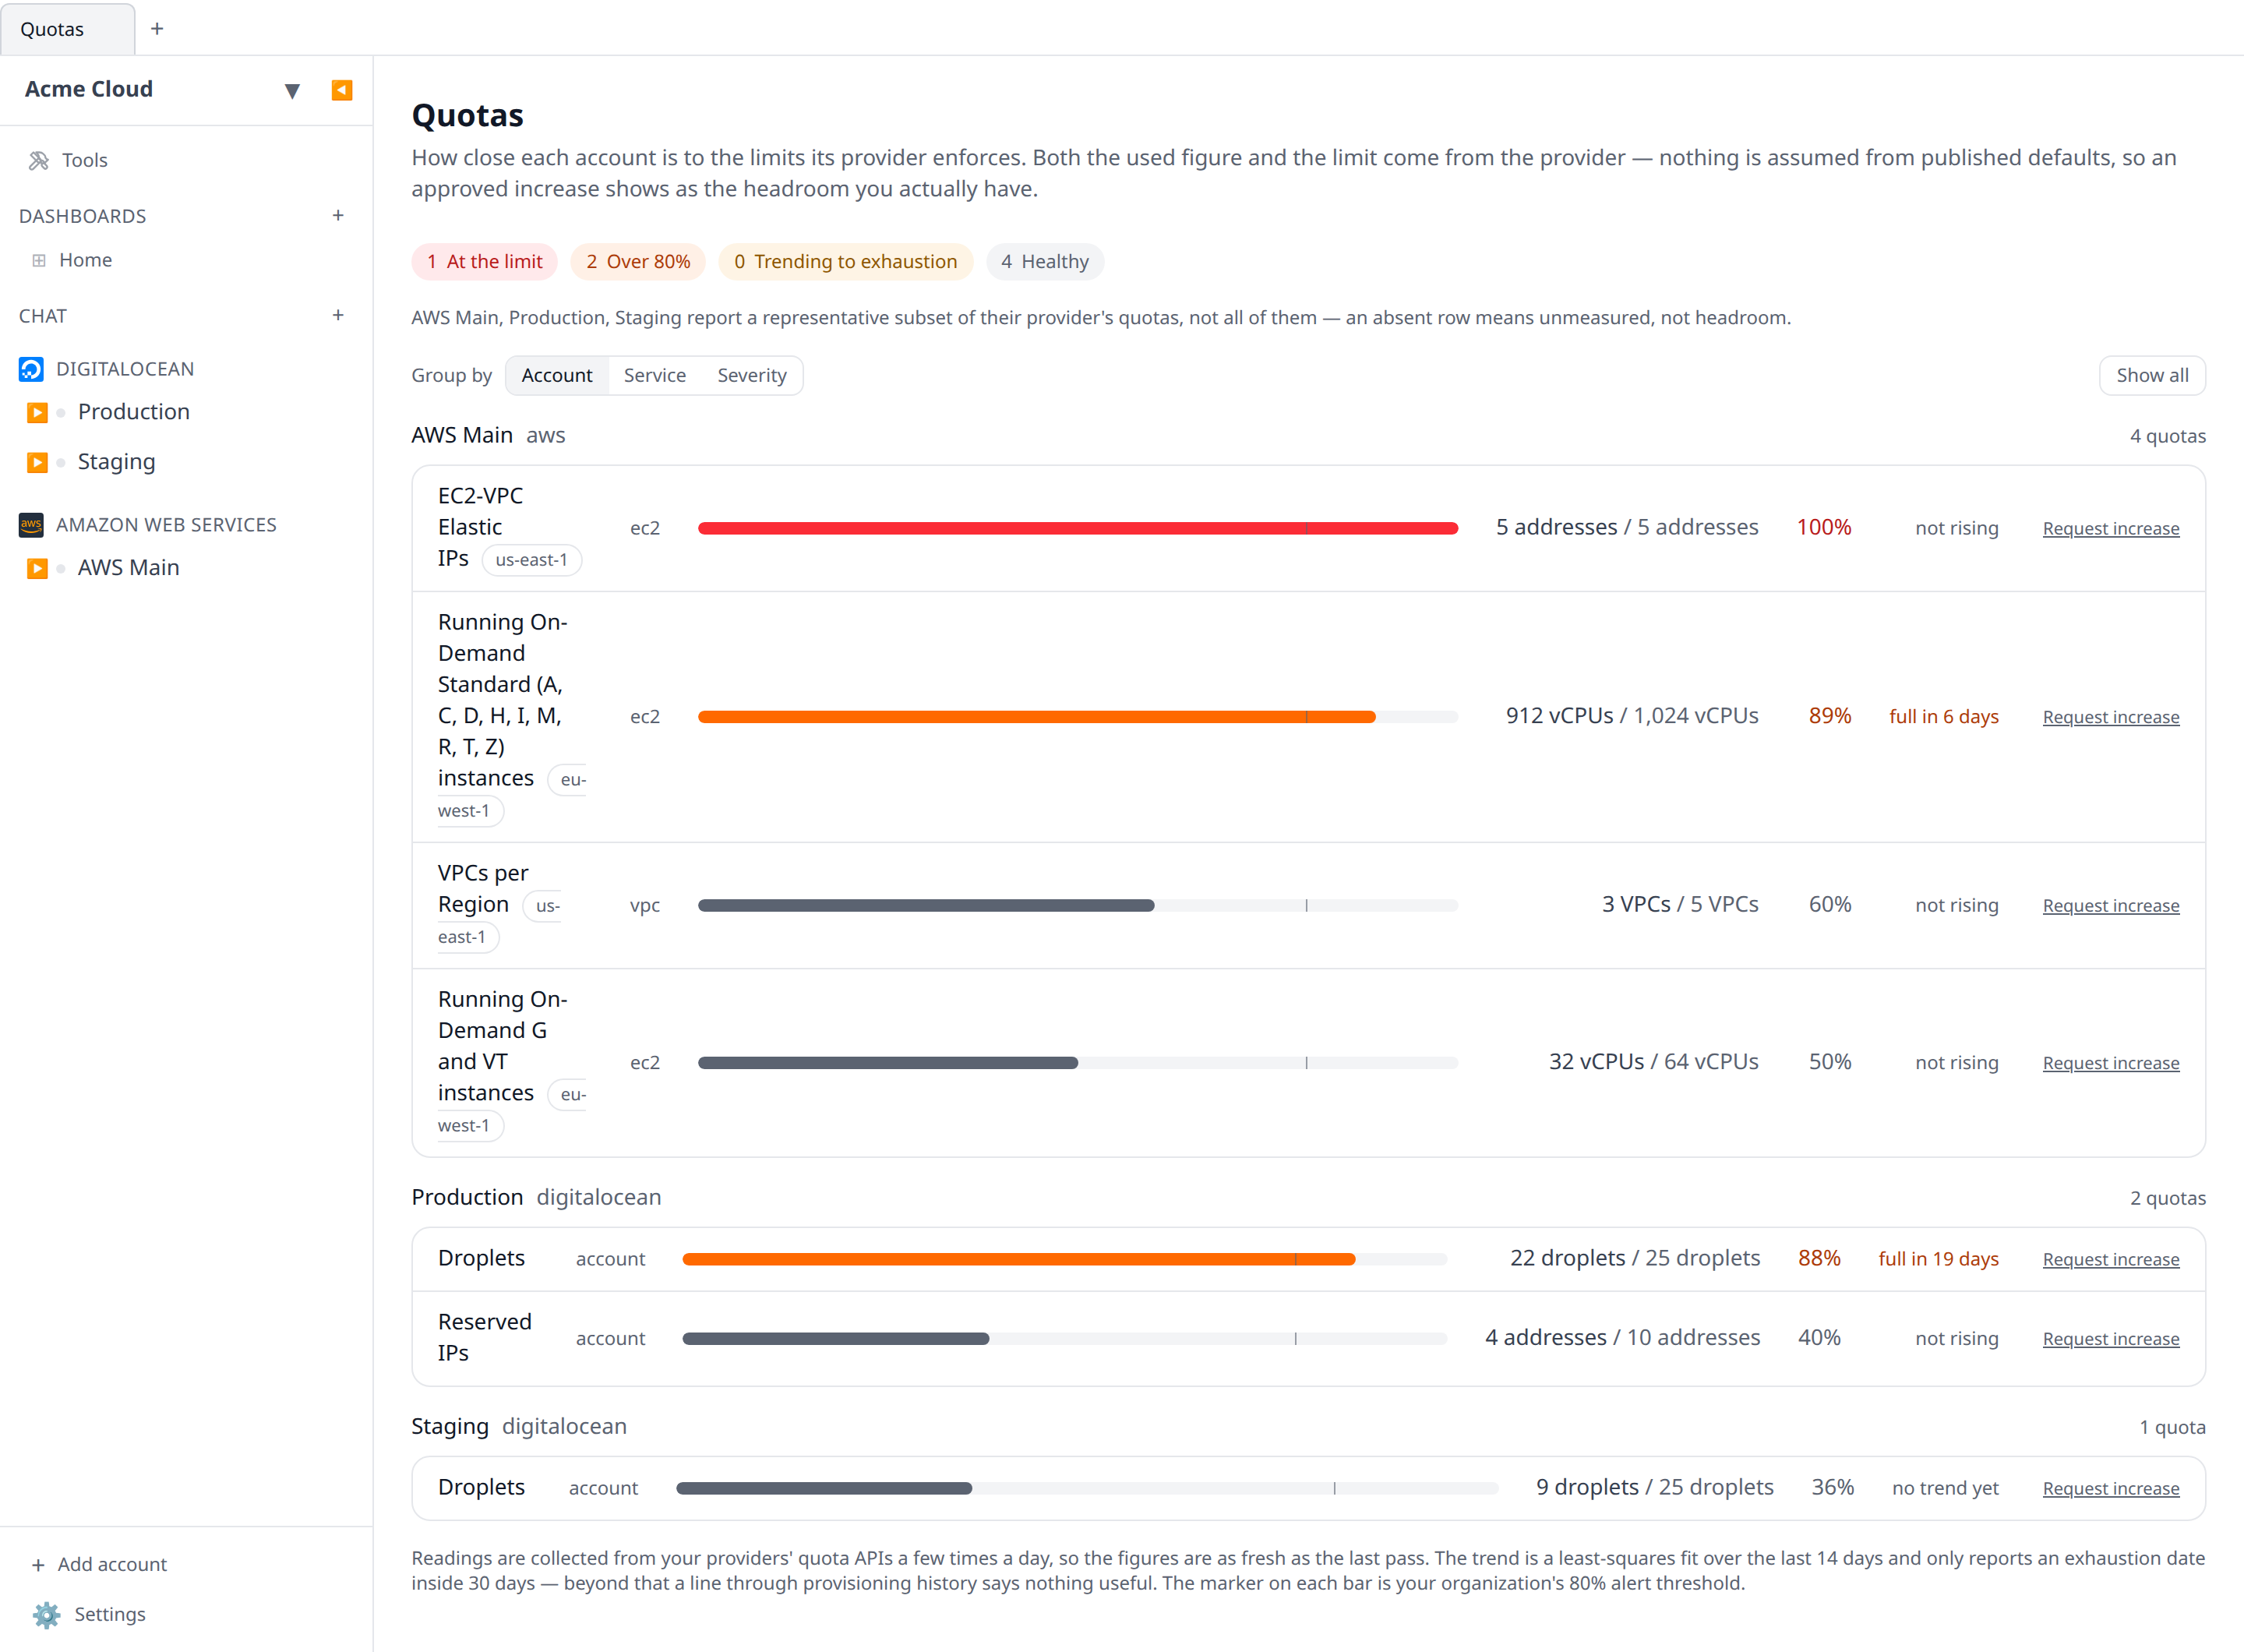
Find it under Quotas in the sidebar on the web app and on the desktop app in cloud mode.
Both numbers come from your provider
Every row is a pair: what you are using, and the ceiling that will be enforced. Neither is assumed. Infrawrench never fills a limit in from a published default, because the accounts that most need this page are exactly the ones that have already had an increase approved — and reporting such an account at the documented default would say it was exhausted while it had thousands of vCPUs spare.
The flip side of that rule is that Infrawrench will show you nothing rather than a reassuring zero. A provider with no quota API contributes no rows, and the page names it under the table rather than leaving you to read the silence as headroom. The same goes for an account whose collection is failing: that account gets its own line saying so, with a link to the fix when the failure was a missing permission rather than an outage.
What “trending to exhaustion” means
Under each bar Infrawrench fits a straight line through the last 14 days of snapshots and extrapolates it. If the line reaches the limit within 30 days, the row says so — full in 6 days — and the quota is flagged even when it is nowhere near your threshold yet.
Three deliberate limits on that number:
- It needs at least three readings. Two points always fit a line perfectly, and the line through two readings either side of one deploy projects that deploy repeating forever. With too little history the column says no trend yet, which is not the same claim as “safe”.
- It is a least-squares fit, not first-versus-last. A quota that sat flat for a fortnight and jumped this morning has a first-versus-last slope that predicts exhaustion tomorrow; the fit through every point says what actually happened, which is that something changed once.
- It will not project past 30 days. A line through provisioning history says something useful about next week and nothing at all about next quarter.
The limit is stored on every snapshot, not just the current one, so an approved increase does not retroactively rewrite last week’s utilisation. A quota that was at 95% before the increase stays at 95% in the history — which is the fact worth keeping.
The threshold, and the alert
By default a quota is flagged once it passes 80% of its limit. Change it in the organization’s quota settings; it has to be between 50% and 99%. Below half, every quota you own is “critical” and the page stops meaning anything; at 100% the provider is already refusing requests, so the alert would be reporting an outage rather than warning about one.
Alerts go out through your existing alert routing under the Quotas trigger, so they land in whichever Slack channels, Microsoft Teams webhooks and phones your rules already name — there is no separate quota-notification setting to configure. The message is one digest per organization per day, never one notification per quota, and it leads with anything already at its limit:
Quota radar: 1 quota at the limit, 3 approaching 1 at the limit · 3 over threshold • prod-aws · ec2 Running On-Demand Standard instances (eu-west-1) — 912 vCPUs of 1,024 vCPUs, 89%, full in 6 days
The weekly digest carries a Quotas line with the same count.
Which providers report quotas
| Provider | What is read | Complete? |
|---|---|---|
| AWS | Service Quotas for the ceiling; CloudWatch AWS/Usage and two describe calls for the usage. On-demand standard and GPU vCPUs, Elastic IPs, VPCs per region — per region. | Subset |
| GCP | Compute Engine’s own project and per-region quota arrays — CPUs, disks, addresses, networks, firewalls and the rest, each already carrying both usage and limit. | Every Compute Engine quota |
| DigitalOcean | The droplet and reserved-IP limits on your account, counted against your current droplets and reserved IPs. | Subset |
| Kubernetes | Every ResourceQuota object in the cluster, across all namespaces — CPU, memory, storage, pod and object counts per namespace. | Every ResourceQuota |
The “subset” rows are marked on the page too, under the table: AWS publishes thousands of quotas and Infrawrench asks about the handful that actually stop deploys, while DigitalOcean’s API exposes only two of the limits it enforces. An absent row on those providers means unmeasured, not fine.
Hetzner Cloud is deliberately absent. Hetzner enforces per-project limits on servers, primary IPs, volumes and networks, but publishes them nowhere in its API — only in prose documentation. Reporting them from that prose would be exactly the invented limit this feature refuses to show you, so Hetzner accounts contribute no rows and are named as unsupported instead. The same applies to Cloudflare, Vercel, Fly.io and Scaleway.
Permissions and cost
Reading the page needs resources:read. Changing the threshold needs org:settings:write —
the same gate as the other alert settings, because the threshold decides what your channels
and phones hear about.
Collection runs in the cloud poller roughly every six hours per account, so the figures are never more than a few hours stale. On AWS the CloudWatch reads are metered against your own account; they are a handful of requests per region per pass, and Infrawrench skips asking for the limit at all on a quota nothing is using, which is most of them in most regions.
Related
- Synthetic probes — is the endpoint reachable from outside?
- Expiry radar — the other countdown: certificates, domains and tokens.
- Metric threshold alerts — pages off metrics rather than limits.