Public status pages
Publish the synthetic probes you already run at a public link — current state, 24-hour uptime and 90 days of history, with no probe URLs or account details exposed.
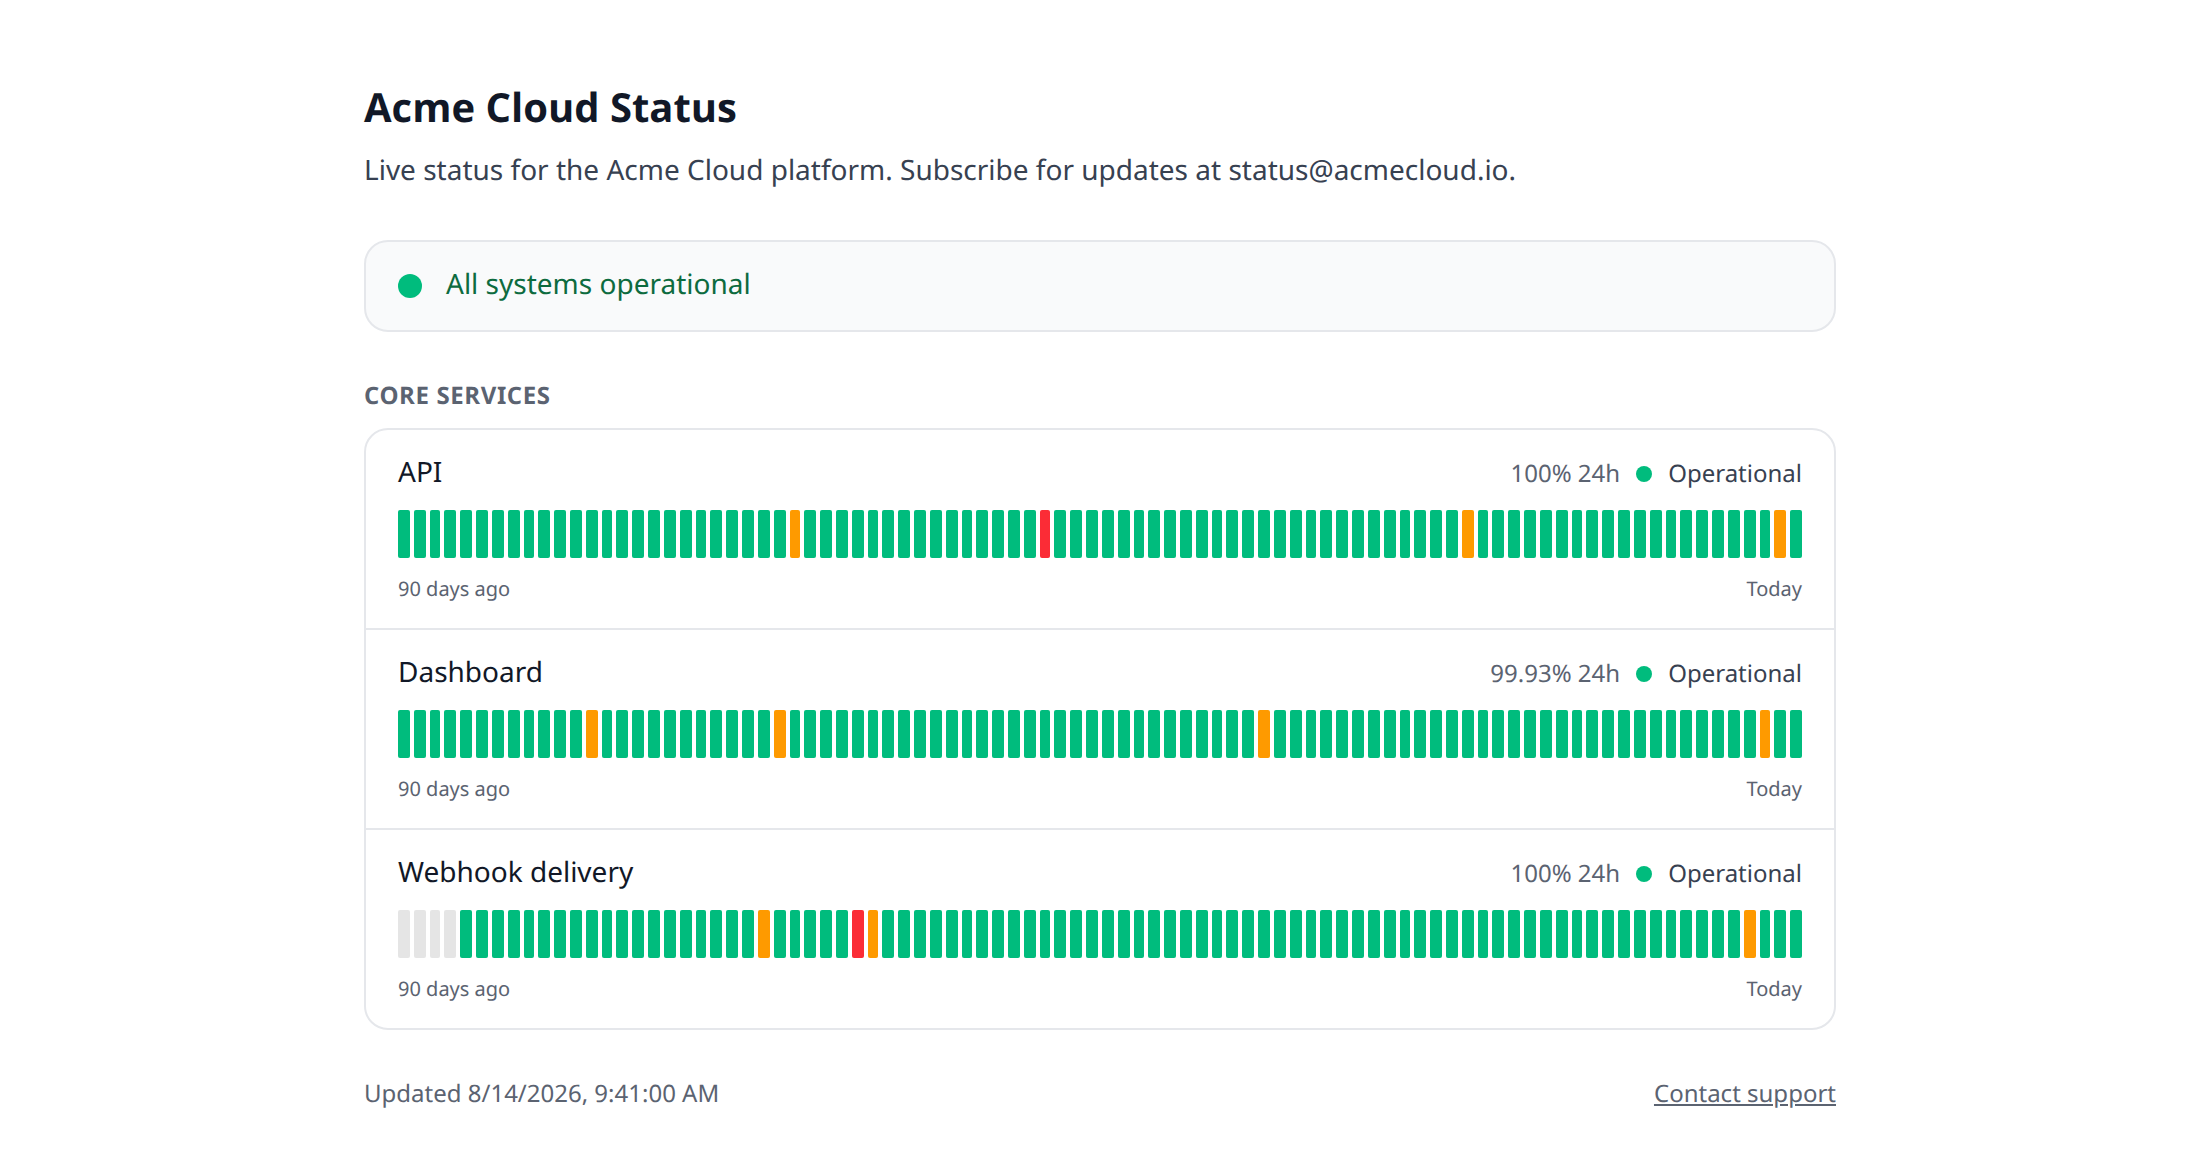
You are already checking whether your endpoints answer, from outside your infrastructure, every minute. A status page points that monitoring outward: pick some of your synthetic probes, give them names your customers would recognise, and publish them at a link anyone can open without an account.
Nothing new is measured. A status page is a second read of probe results you already have, so it costs no extra checks and cannot disagree with what your Probes tab says.
Find it on the Status pages tab of the web and desktop apps (its own sidebar entry, next to
Probes). The mobile app shows a read-only list of your pages and whether each is live, and the
infrawrench CLI answers the same question with infrawrench status-pages.
Nothing is public until you publish it
A new page is created as a draft. It has a link, you can open it yourself to check what it looks like, and anyone else who tries that link gets a 404. It becomes readable only when you press Publish, and the app asks you to confirm — naming how many components you are about to expose — before it does.
The link is the only credential
There is no org id in a status page URL and no sign-in on it. The slug is 22 random characters,
generated rather than derived from your title, so acme-status is not guessable by anyone who
knows your company:
https://app.infrawrench.com/status/hq7mfp2wknx4bvz9td3rcsTreat it as a secret you have chosen to share widely. If it ends up somewhere you did not intend — a public repo, a screenshot, an ex-contractor’s bookmarks — press New link. The old URL stops working immediately and the page stays published at its new one.
Unpublishing does the same thing more bluntly: the page 404s for everyone until you publish it again.
What a visitor can see, and what they can’t
The public payload is built specifically for publication, not filtered down from the internal one. It contains:
- the page title and description you wrote
- each component’s public name, its group heading, and its current state
- 24-hour uptime, if you enabled it
- 90 days of daily uptime bars, if you enabled them
- your support link, if you set one
- any notices posted on the page — a written update’s title, body, state (investigating / identified / monitoring / resolved), its timestamps, and which components on that page it names
It does not contain the probe’s URL, HTTP method, interval, failure threshold, last status code or error text, nor any resource id, account name, plugin name, or your organization id. Even the probe ids are absent — components are identified by their own ids, which reveal nothing about your monitoring setup.
An unpublished page and a slug that never existed return the same 404, so the link cannot be used to work out which slugs are real.
A notice posted by incident mode is subject to exactly the same rule: the declared incident’s id, who declared it, and everything else about your organization stay out of the public payload. A visitor learns that something is wrong and what is being done about it.
Notices: the one sentence a human writes
Everything above is derived — it comes from probe state and uptime rollups, and no person types it. A notice is the exception, and it is what visitors actually turn up for: “we know, we’re on it.”
Notices render above the component list, newest first, in the usual investigating → identified → monitoring → resolved vocabulary. Unresolved notices always show; resolved ones stay for a fortnight so somebody arriving the morning after still sees what happened.
Usually you do not write one by hand: declaring an incident with Tell the public ticked posts it, and resolving the incident closes it. See Incident mode.
Give components public names
A probe called prod-api-lb health eu-west-1 is a good operational name and a bad public one. Each
component on a page takes a public name that replaces it — “API”, “Dashboard”, “Webhooks” —
plus an optional group heading so related components sit together:
| Probe | Public name | Group |
|---|---|---|
prod-api-lb health, eu-w1 | API | Core services |
prod-web-cdn root | Dashboard | Core services |
hooks-worker /healthz | Webhook delivery | Background |
Leave the public name blank and the probe’s own name is used — which is a deliberate choice you are making, not an accident, so check it reads the way you want.
Drag order is render order: the arrows beside each component move it up and down the page.
How the states are decided
Each component’s state comes from the probe’s own state machine:
| Probe | Component shows |
|---|---|
| Up | Operational |
| Down (past its failure threshold) | Down |
| No result yet | No data |
| Paused | No data |
A paused probe reads as “No data” rather than keeping its last green. The page is a claim about what is being checked now, and showing the result from before someone paused the check would not be true. The editor warns you when a page publishes a paused probe.
The banner across the top rolls the components up:
- All systems operational — everything being measured is up
- Some systems are experiencing issues — some but not all are down
- Major outage — everything being measured is down
- Status unavailable — nothing has reported yet
Components with no data are ignored in that rollup rather than dragging the whole page to unknown, so adding one new component doesn’t blank a page that is otherwise reporting fine.
The uptime history is honest about gaps
Each daily bar is the fraction of that day the endpoint was up, computed from the same recorded
Up series the probe charts use. A day with no recorded data renders grey — not green, and not
red. A page you created last week shows seven coloured bars and 83 grey ones, rather than claiming
three months of perfect uptime it has no evidence for.
Days are UTC. Bars are green at 99.9% and up, amber above 99%, red below.
Permissions
Managing status pages rides the same permissions as the probes they publish: resources:read to
see them, resources:write to create, edit, publish, rotate a link, or delete. Whoever can create
the monitoring can decide what of it is public.
Publishing, unpublishing, rotating a link and deleting all write to the audit log — publishing in particular, since that is the moment a page became readable by anyone with the link.
Related
- Synthetic probes — the checks a status page publishes
- Metric alerts — the private half: alerting your team rather than telling your customers
- CLI —
infrawrench status-pagesfor “what of our monitoring is public right now?” - Incident mode — what usually writes a notice, and what closes it