Log workspace
Tail several resources' logs in one pane, search across the merged stream, save the set-up as a named query, and optionally alert when a line matches.
Chasing a request across a pod, the deployment behind it, and the managed database it talks to usually means three browser tabs and a lot of eyeballing. The Log workspace tails several log-capable resources in one pane — interleaved with per-resource colour labels or split into stacked panes — with one search box that filters every stream at once. Name the set-up and save it as a query so the workspace reopens with one click, and optionally flag it to alert when a matching line appears.
Opening the workspace
Click Logs in the sidebar (web and desktop). Add resources with the picker — it lists every synced resource whose plugin can fetch logs for it, discovered from the plugin contract rather than a hardcoded provider list. Typical sources are Kubernetes pods, deployments, jobs and the other workload types, GCP Cloud Run services and Cloud Functions, and DigitalOcean managed databases.
The picker also reaches inside managed clusters: a GKE, DOKS, or other managed Kubernetes cluster’s pods and workloads are listed live through the cluster’s Kubernetes integration — the same connection its Kubernetes tab uses — and appear labelled with the cluster they belong to (api-0 · prod-cluster · My GCP). You don’t need to connect the cluster as a separate Kubernetes account. Because these entries are listed from the provider on the spot, a cluster that is unreachable at that moment simply contributes no entries until the picker is reopened.
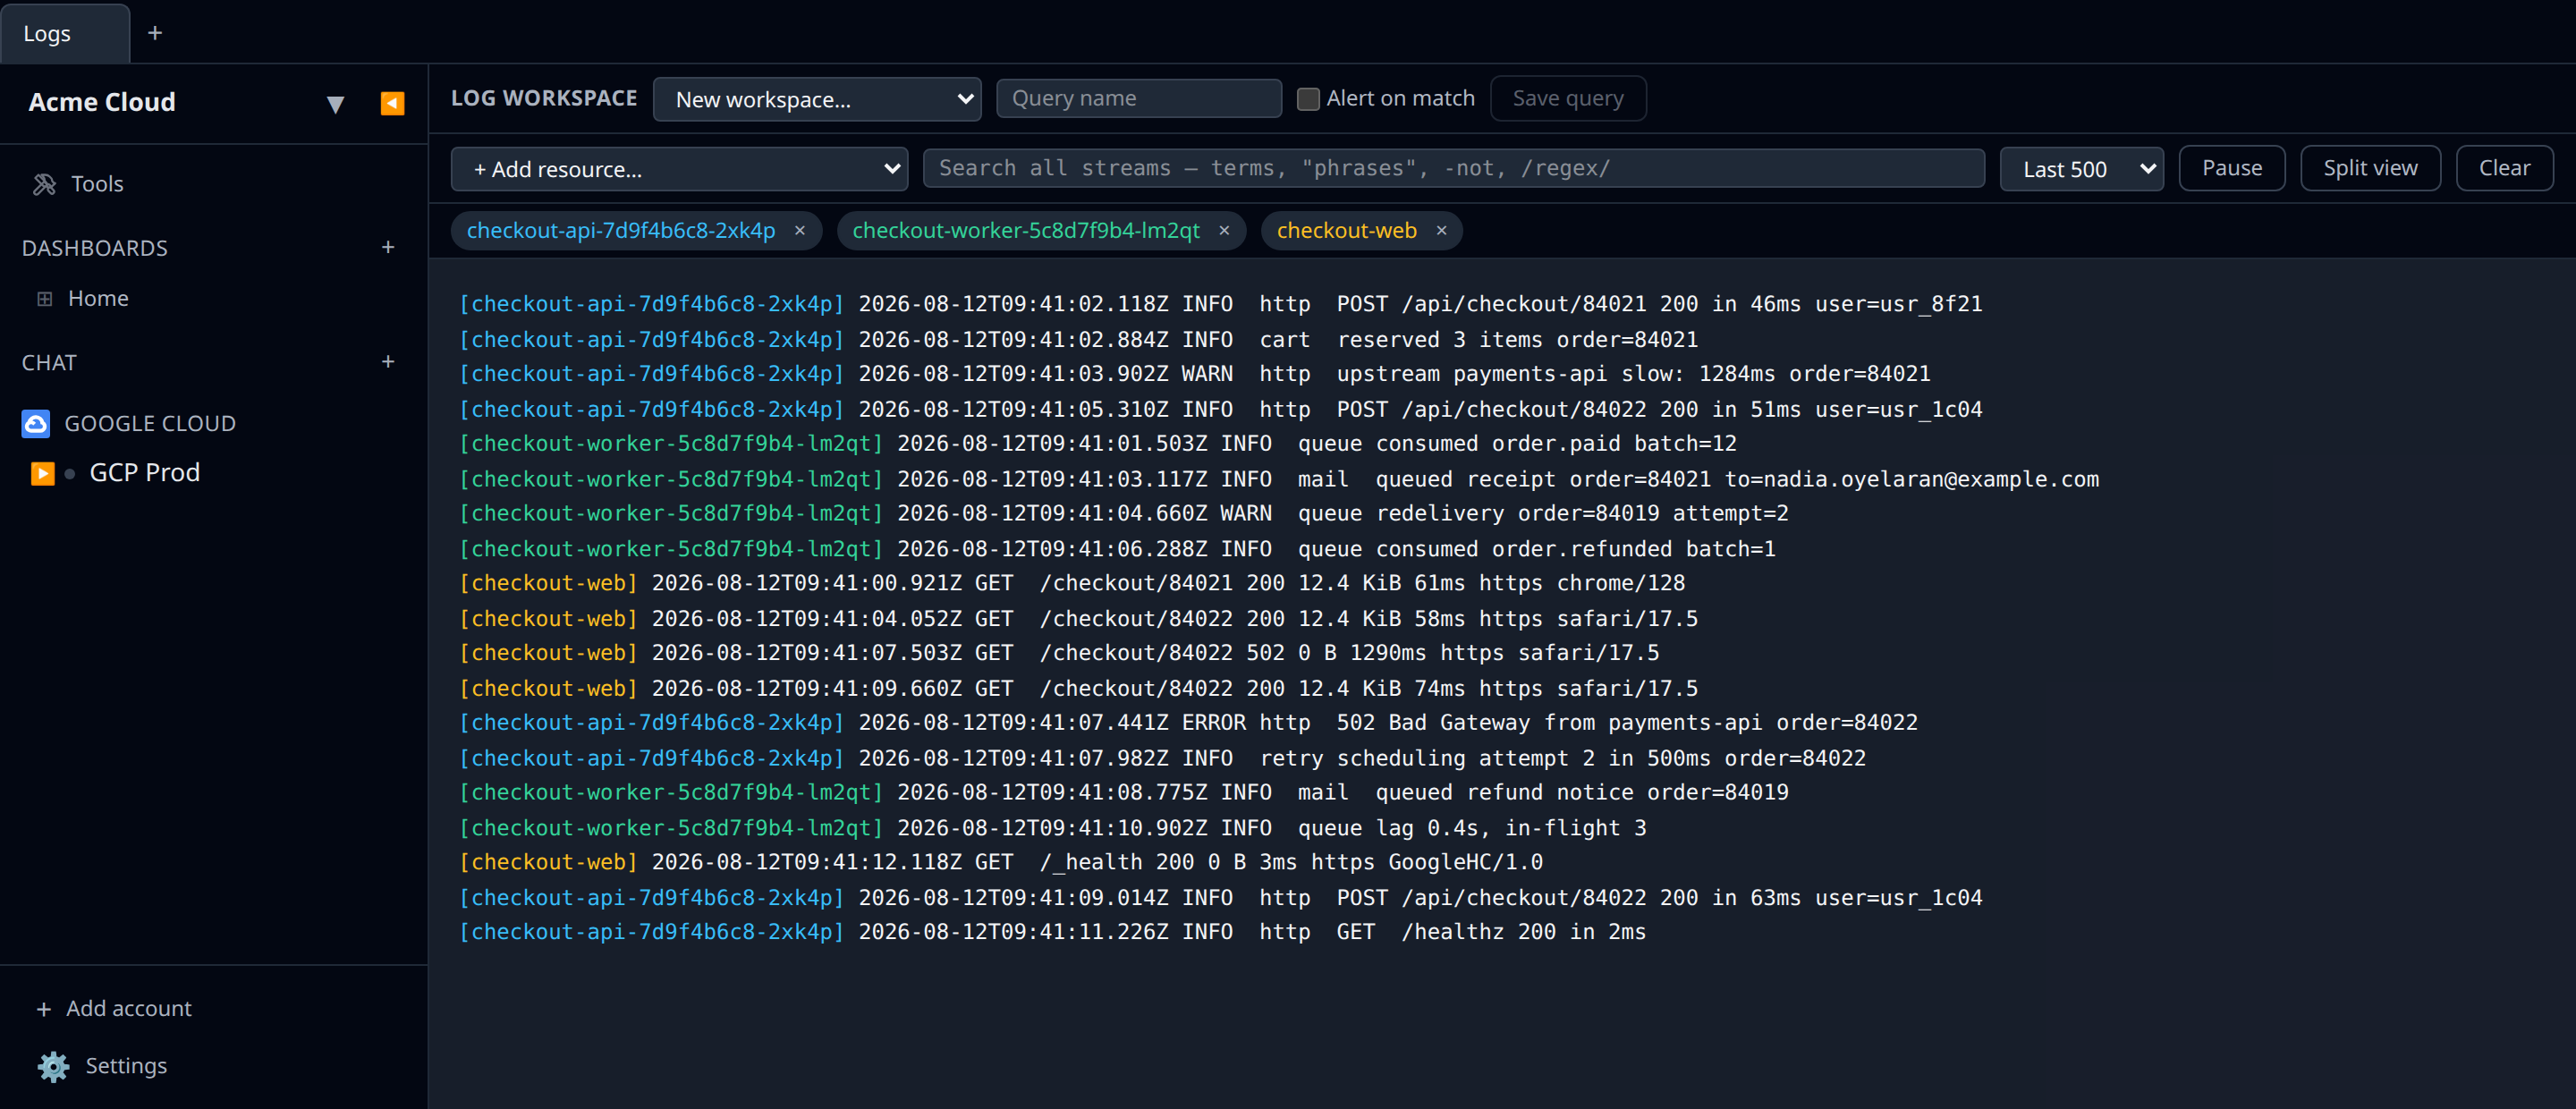
Each stream is tailed through the same per-resource log machinery as the resource’s own Logs tab, refreshed every few seconds. Per stream you can pick the container (when the resource has more than one) or remove it; workspace-wide you get:
- Pause / Resume — freeze the pane while you read, then catch up.
- Interleaved / Split view — one merged stream in arrival order, or a stacked pane per resource.
- Tail length — how many lines to keep fetching per stream.
- Search — one expression filtered across every stream, applied instantly client-side.
Search syntax
The search box is deliberately grep-simple:
timeout upstream— every term must appear in the line (case-insensitive AND)."connection reset"— quoted phrases keep their spaces.error -healthcheck— a leading-excludes lines containing the term./HTTP [45]\d\d/— wrap the whole expression in slashes for a regular expression (/…/ifor case-insensitive).
The same expression is evaluated by the server-side alert pass, so what matches in the filter box is exactly what an alert would fire on. One guard rail: regex shapes prone to catastrophic backtracking — a quantified group that itself contains a quantifier or alternation, like (a+)+ or (a|aa)* — are rejected with an inline error, since the same pattern would otherwise run in the alert poller.
Saved queries
Give the workspace a name and click Save query — the name, the set of streams (including chosen containers) and the search expression are stored per organization, so anyone with resource access can reopen the workspace from the dropdown. Saving, editing, and deleting are recorded in the audit log.
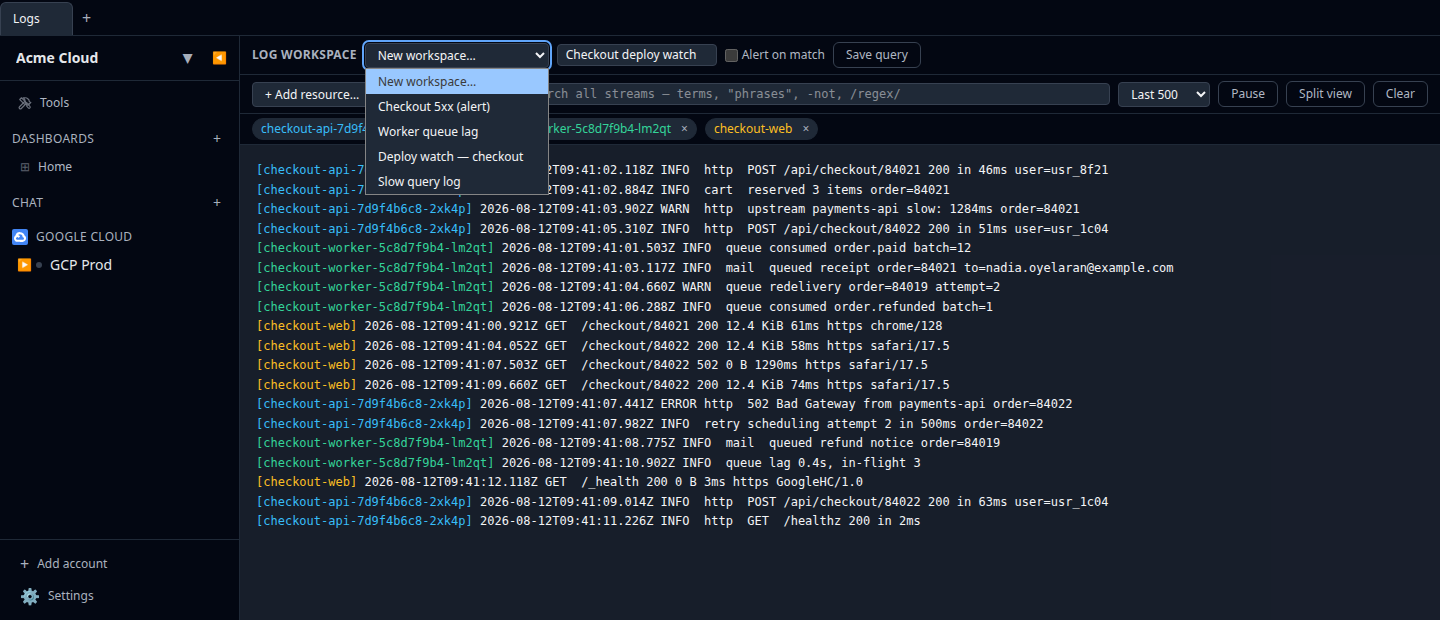
Saved queries live in the cloud: on desktop they appear when signed into an org. Local-only desktop mode still gets the full multi-resource tail pane — resources are discovered from the local workspace and tailed directly — just without saved queries or alerting.
Alert on match
Tick Alert on match on a saved query and the cloud poller evaluates it every few minutes: it fetches a bounded tail window for each of the query’s resources (the last few hundred lines), runs the search expression over it, and notifies when any line matches — via mobile push, Slack, and Microsoft Teams under the Log matches trigger, which every channel and member can toggle in notification settings.
The pass is deliberately conservative:
- Bounded lookback — only a fixed tail window per resource is fetched, and match counting stops at a cap; an alert reports “25+ lines” rather than scanning forever.
- Cooldown — at most one notification per query per 30 minutes, so a service that keeps logging errors reports “still matching” on the next cooldown boundary instead of re-firing every pass.
- Never silent — evaluation failures (a resource deleted upstream, credentials gone stale) are recorded on the query and shown wherever it is listed.
An alert needs a non-empty search expression — an empty query matches every line and would fire forever.
Cluster streams can be alerted on like any other: the pass reconnects through the parent cluster each run. Keep in mind that pods are ephemeral — if a saved query tails a pod that has since been replaced, that stream reports an error until you re-pick the new pod (tailing the deployment instead sidesteps this, since its logs follow whichever pod is currently running).
Other surfaces
- Mobile lists the org’s saved queries (from the Accounts tab) and opens a read-only viewer that tails a query’s streams with the saved filter applied — the deep-link target of a log-match push. Composing queries stays on web and desktop.
- API: saved queries are plain CRUD under
/api/org/{orgId}/log-workspaces— see the OpenAPI spec.
Permissions
Viewing the workspace and saved queries needs resources:read — the same permission that gates each resource’s own Logs tab. Saving, editing, and deleting queries (including the alert toggle) need resources:write.