Metric alerts
Threshold rules over collected metrics — "CPU above 90% for 15 minutes" — that select resources by query and page you through push, Slack, and Microsoft Teams, with recovery notifications when the condition clears.
Infrawrench collects metrics for your resources and charts them on dashboards and detail views. Metric alerts turn those same metrics into pages: a rule like “CPU % > 90 for 15 minutes” watches every resource it covers and — if you have notifications configured — fires as a push notification, a Slack message, or a Teams card the moment the condition has held for the whole window. When the metric drops back under the threshold, every firing you were notified about is followed by a matching resolved notification, so an alert channel tells you both halves of the story. (Firings suppressed by the rule’s cooldown recover just as quietly as they fired — see below.)
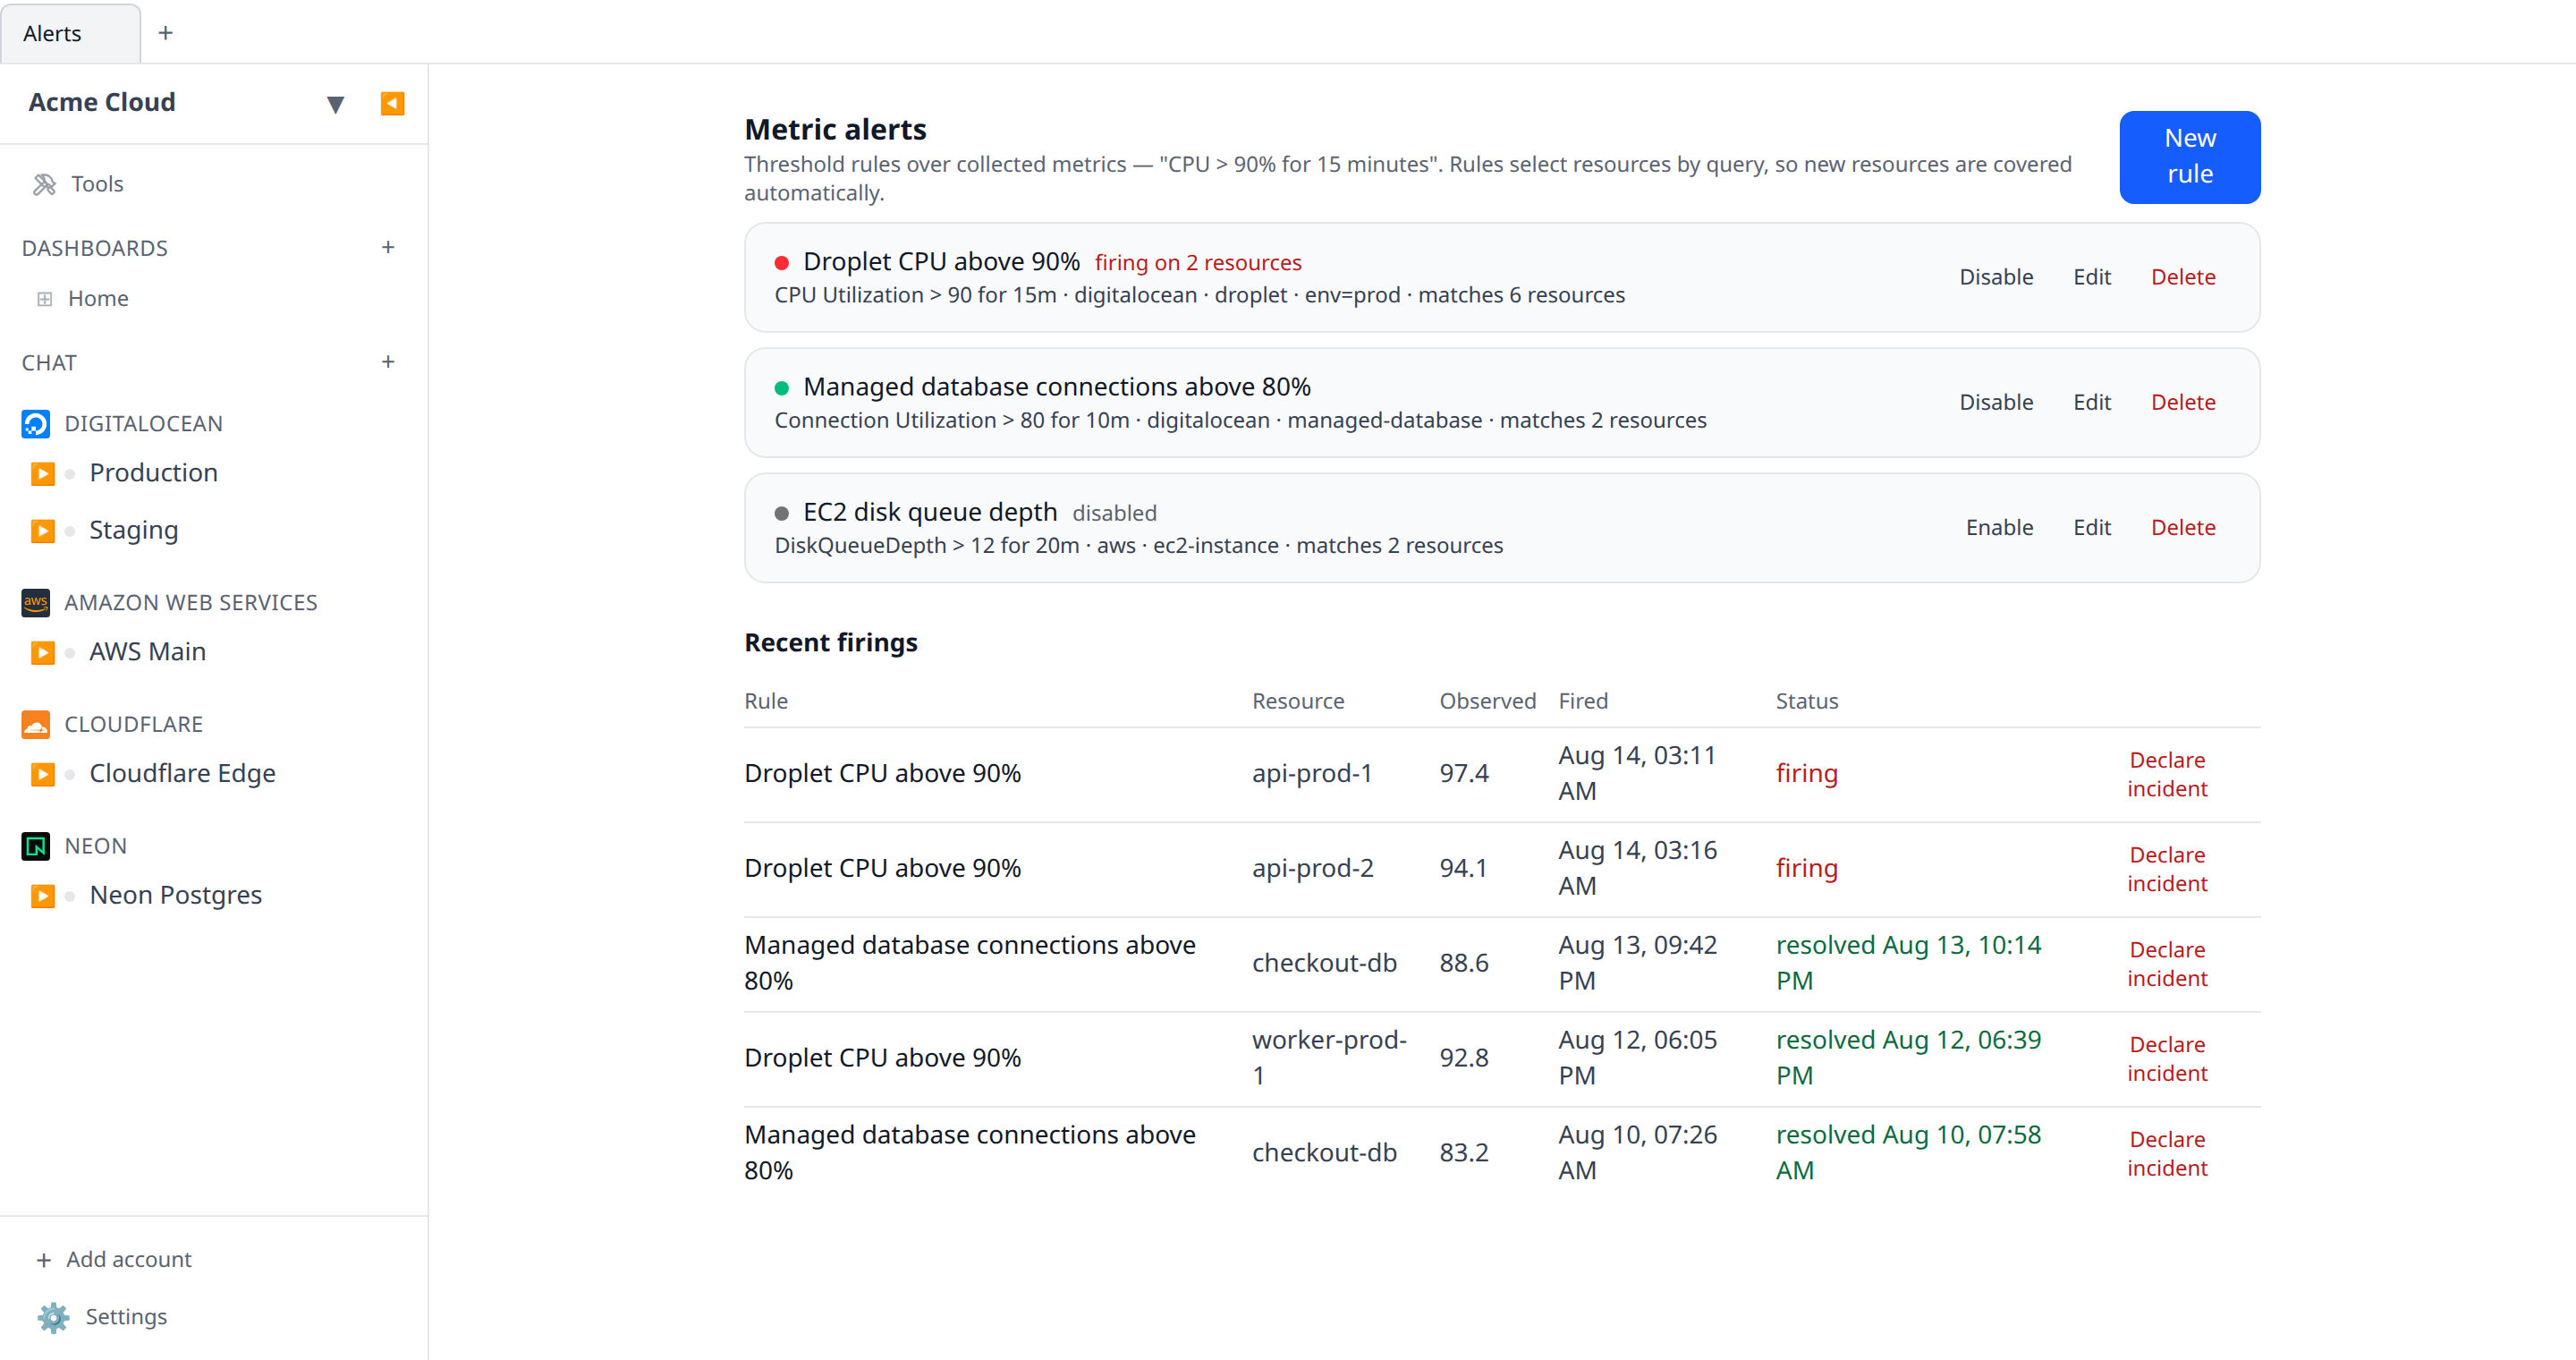
Find it under Alerts in the sidebar, next to Costs, on both the web app and the desktop
app. The infrawrench CLI lists the same rules and their firing history with
infrawrench alerts and infrawrench alerts events.
Rules select resources by query, not by id
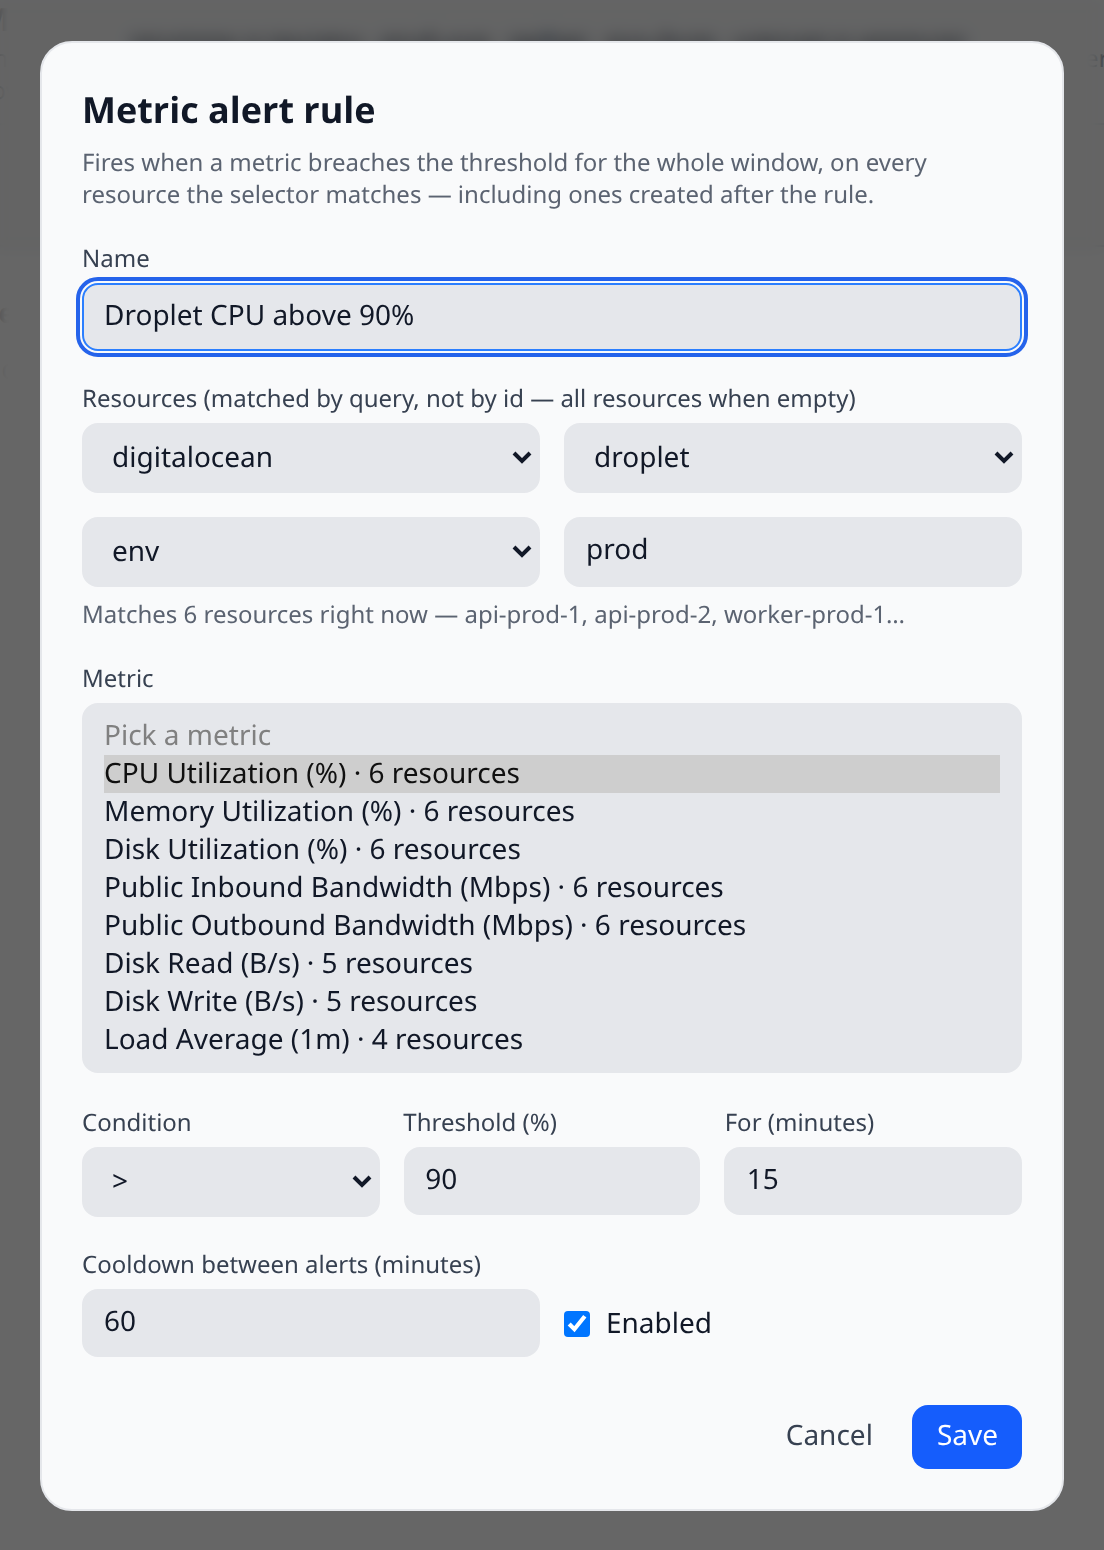
A rule never lists resource ids. Its scope is a query — any combination of:
- a provider (e.g. AWS, Hetzner, DigitalOcean),
- a resource type within that provider (e.g. EC2 instance),
- a tag (a key, optionally pinned to one value — e.g.
env=prod).
Every evaluation pass re-runs that query against your live inventory. A VM created tomorrow
with the env=prod tag is covered by tonight’s rule with no edit; a resource that is deleted
or re-tagged out of scope stops being watched, and any open alert on it resolves. Tag keys
match case-insensitively (providers disagree about casing), values exactly. An empty selector
covers every resource in the organization.
Directly under those four controls — and above the Metric picker — the editor shows a live preview: “Matches 6 resources right now”, with the first few named. It updates as you narrow the selector, so you see the blast radius before saving rather than after.
Picking a metric
The metric picker is fed from the series your resources actually reported over the last seven days, narrowed to the provider and type you selected — you pick “CPU %” or “Memory used” from a list (with its unit and how many resources report it), never type an internal metric name. If the list is empty, resources of that shape have not reported metrics yet.
How evaluation works
- Rules are evaluated by the cloud poller roughly once a minute per enabled rule.
- Each pass reads the trailing window (
forminutes) of per-minute averages for the rule’s metric on every selected resource. - A rule fires on a resource only when every sample in the window breaches the threshold, with enough samples spread across the window to make that claim — a single noisy reading, or two minutes of data in a fifteen-minute window, does not open an alert.
- One firing is one incident: while an alert is open for a (rule, resource) pair, further breaching passes do not re-notify. The incident stays open until a pass observes the condition clear (or the metric stops being reported entirely), which sends the resolved notification.
- The rule’s cooldown bounds flapping: after a notified firing, new firings for the same resource within the cooldown are recorded in the history but not delivered — and since they were never announced, their recoveries are not delivered either.
The window is between 5 minutes and 24 hours; the default is 15 minutes with a one-hour
cooldown. All four comparators are available (>, >=, <, <=), so “healthy replicas
below 2 for 10 minutes” is as expressible as “CPU above 90%”.
Where alerts go
Metric alerts are a standard alert trigger, delivered through the channels you have already configured — see Slack alerts, Teams alerts, and mobile push. Each Slack channel, Teams webhook, and mobile user opts in or out of the Metric alerts trigger independently, in the same place as the budget, anomaly, and drift toggles. New channels take metric alerts by default.
Tapping a metric alert push notification on mobile opens the moment view around the firing, so you can see what else happened at the same time.
Permissions
Viewing rules and firings needs the metric-alerts:read permission (members have it by
default); creating, editing, enabling/disabling, and deleting rules needs
metric-alerts:write (admins and owners). Both are available to
custom roles and
API key
scopes.
From the CLI and the API
$ infrawrench alerts
prod-org · 3 rules · 1 firing

   rule            condition             resources                matches  firing
 ● High CPU        CPU % > 90 for 15m    aws · ec2-instance · env=prod  12       1
 ● Low disk space  Disk free % < 10 for 30m  hetzner                     4        0
 ○ Staging memory  Memory % > 95 for 15m     env=staging                 7        0

$ infrawrench alerts events --limit 20
Both subcommands take --json for scripting. The HTTP API exposes the same surface under
/api/org/{orgId}/metric-alerts — see the OpenAPI reference
(Metric alerts tag) and the generated SDKs.