Custom graphs
Script-defined dashboard charts — query costs, metrics, or any API from a sandboxed script that declares its own chart, controls, and refresh policy.
Cost graphs and budgets cover collected spend, but sometimes the chart you want doesn’t exist yet: spend per customer, error rate against a price line, a number your own API reports. Custom graphs are small TypeScript scripts that run in a server-side sandbox, gather whatever data they need, and describe the chart to draw — including the select menus, checkboxes, and buttons shown on the card, and how often it should refresh.
Custom graphs are available on the paid plan and are cloud-only (the script runs against your organization’s cloud data).
What a graph script can do
The script runs against a global graph object:
graph.costs.query({ days, groupBy, filters, binning, topN })— your organization’s collected spend, the same data behind cost graphs, returned chart-ready.graph.resources.list(filter)— list resources (for building your own pickers).graph.metrics(resourceId, { hours })— provider metric series (CPU, bandwidth, …) for one resource.fetch(url, init)— external HTTP APIs, through the same egress proxy workflows use (public addresses only).graph.data.get/set/delete/list— a private key/value store persisted between runs, for caches and baselines.graph.controls.select/checkbox/text/number/button— declare the card’s controls and read their current values synchronously.infra.accounts.<plugin>— read-only access to your connected accounts, the same tree workflows get: list and fetch resources, resolve outputs, read logs, describe, read manifests, run SQL queries, read KV keys, fetch metrics — and run SSH commands withresource.ssh(cmd). Nothing that provisions or mutates:create,update,delete,applyManifest,importYaml, andpublishare not available in graphs (and don’t appear in the editor’s typings).graph.render({ title, chart, refreshSeconds, notice })— say what to draw:line,area,stacked_bar,multi_bar,pie,stat, ortable.
A minimal graph:
const range = graph.controls.select("range", {
  label: "Range",
  options: [
    { value: "7", label: "Last 7 days" },
    { value: "30", label: "Last 30 days" },
  ],
  default: "30",
});

const costs = await graph.costs.query({
  days: Number(range),
  groupBy: "provider",
});

graph.render({
  title: "Spend by provider",
  chart: { type: "stacked_bar", series: costs.series },
  refreshSeconds: 3600,
});
Changing a control, pressing a declared button, or the refreshSeconds timer elapsing re-runs the script with the current control values; graph.event.button tells the script which button was pressed, so a button can reset a baseline or clear a cached value in graph.data.
Creating one
On a dashboard, choose + → Custom graph, then either pick an existing graph or name a new one — a new graph opens in the script editor, seeded with a working example. The editor type-checks against the graph API and previews the saved script live, controls included.
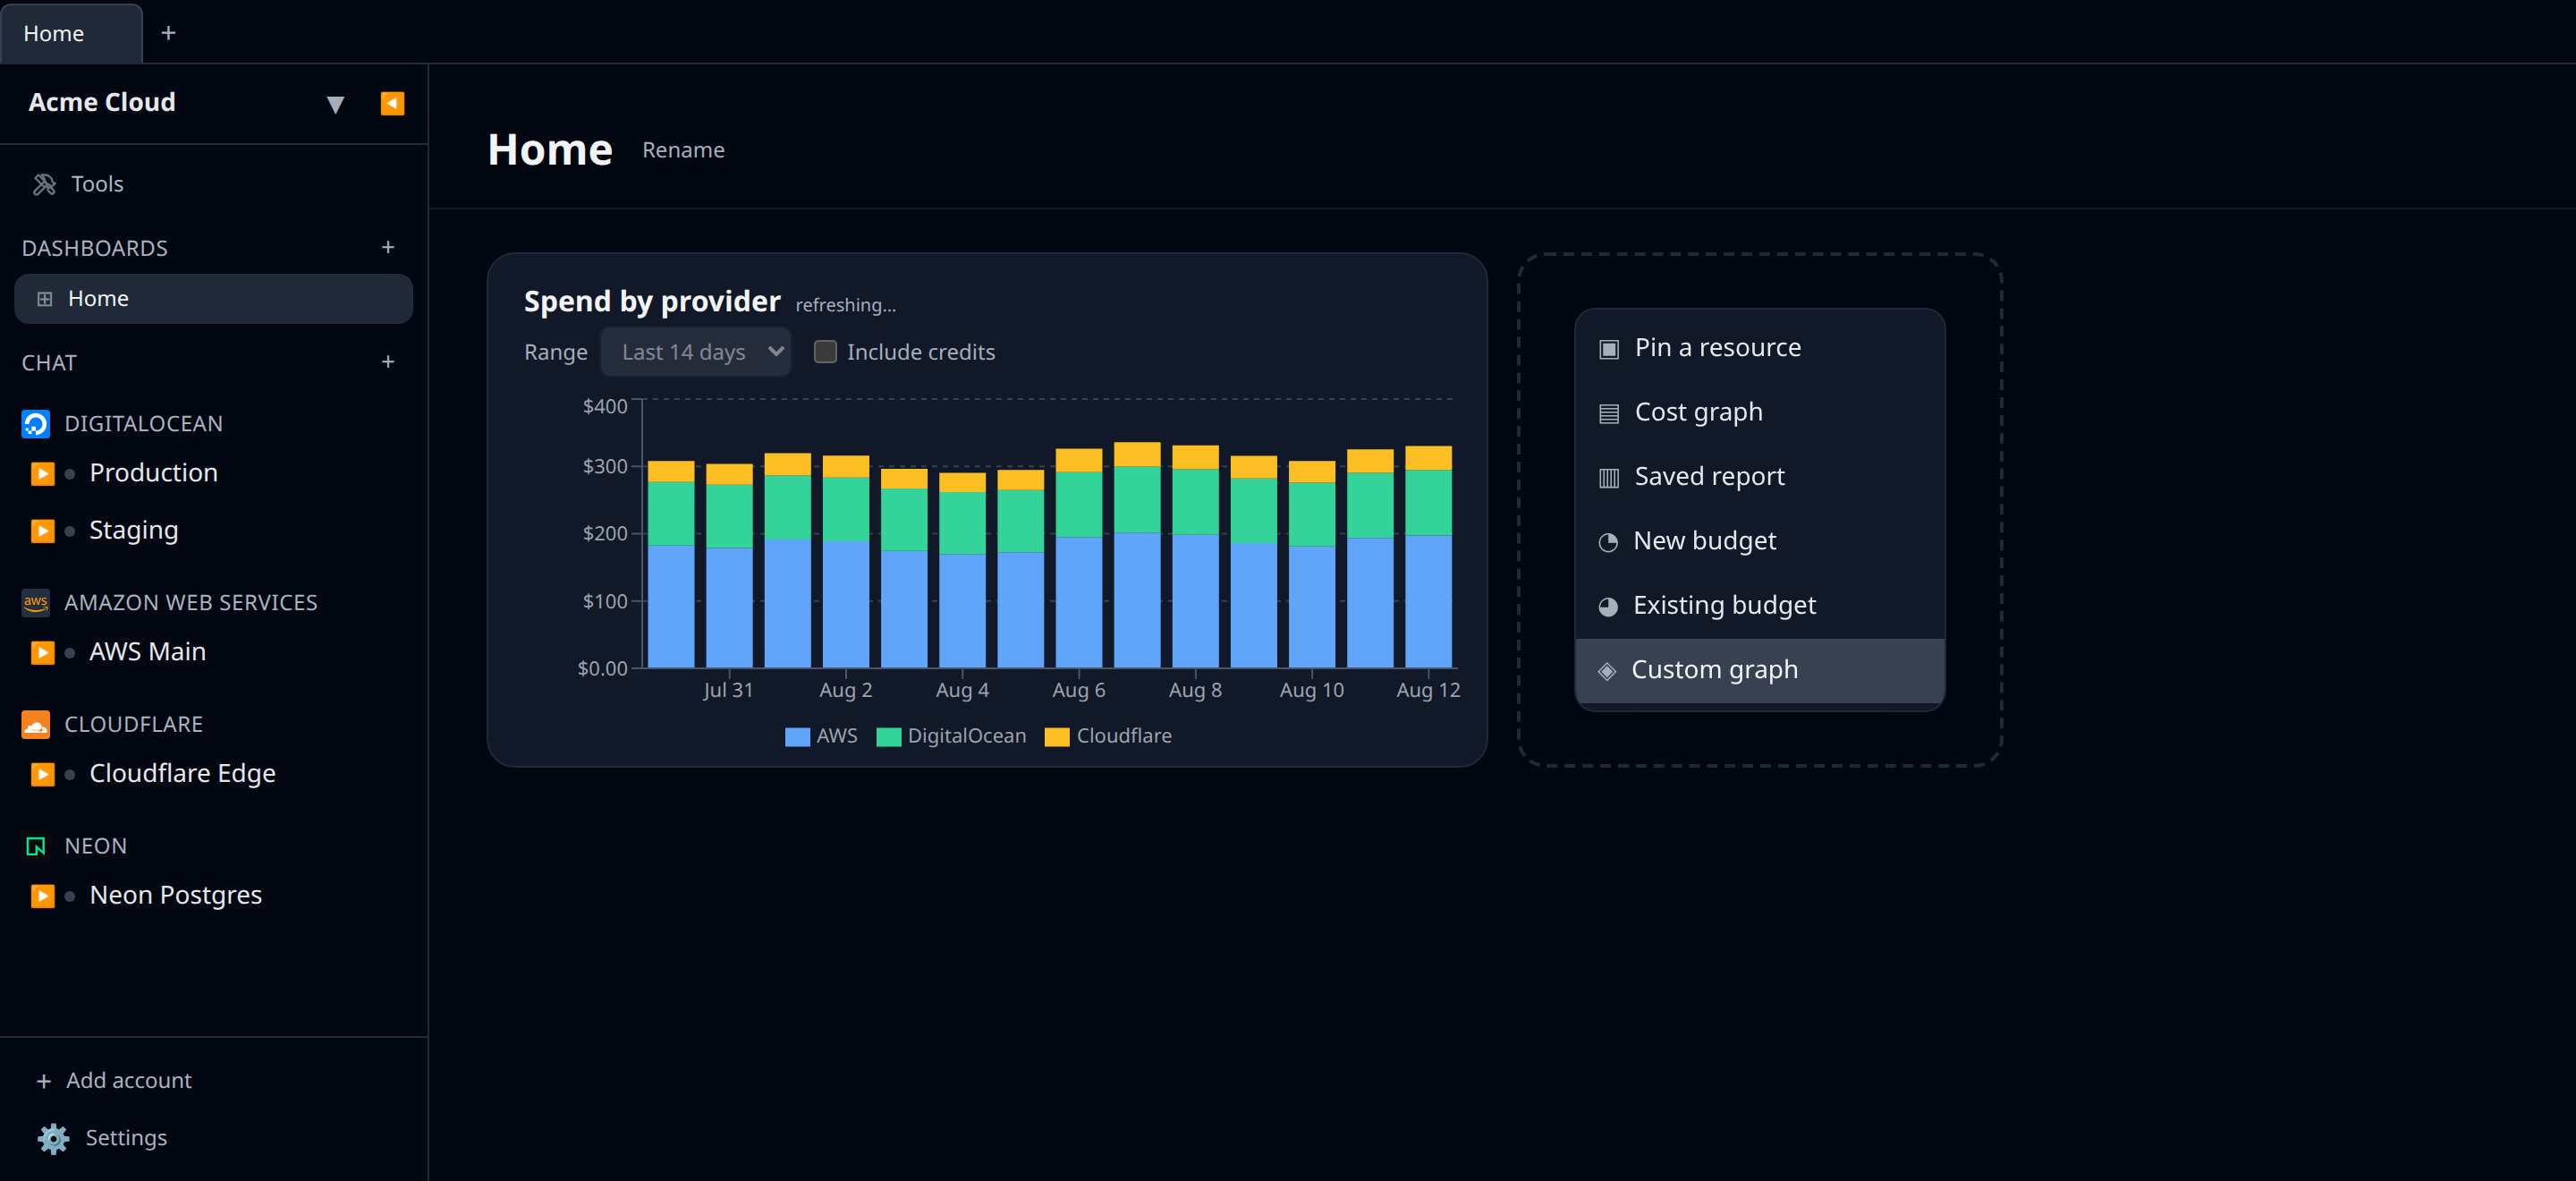
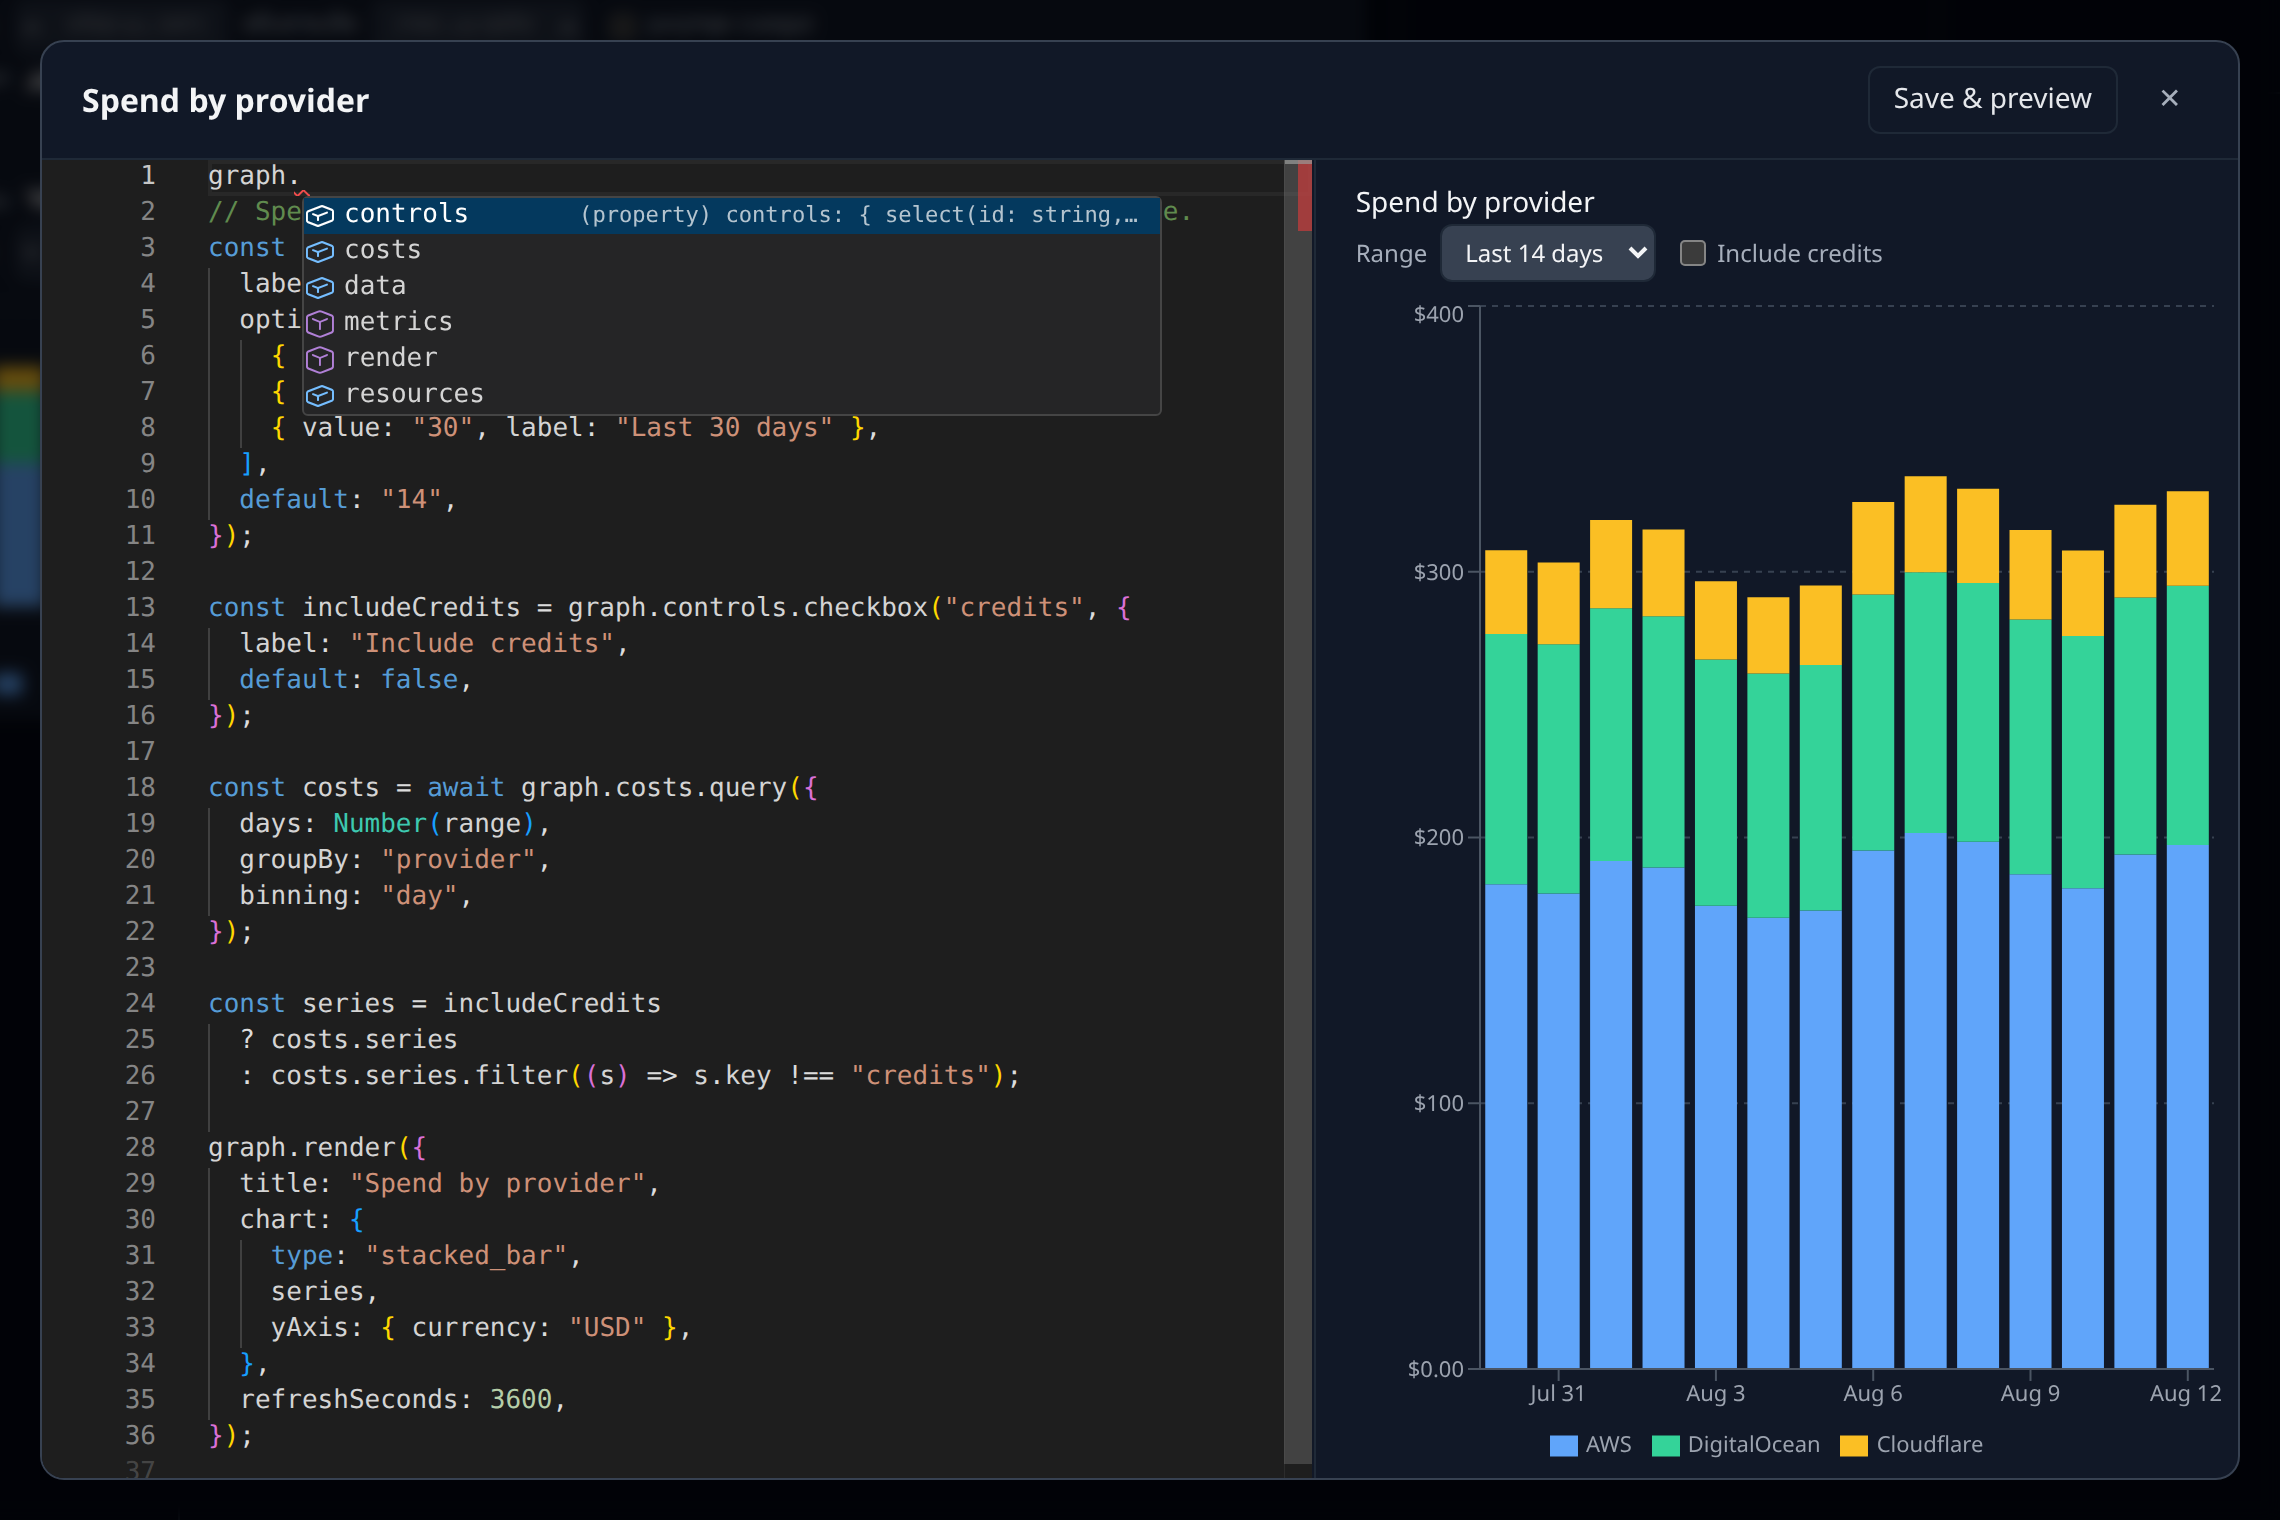
The same graph can sit on any number of dashboards; removing a card leaves the graph itself alone, and deleting a graph removes every card showing it. The picker doubles as the management surface — hover a row to edit a graph’s script or delete it outright, including graphs that currently sit on no dashboard at all.
Creating one with AI
Custom graphs are designed to be written by an AI over MCP or the in-app chat. The model calls get_custom_graph_typings for the full graph API, writes the script with write_custom_graph (the source is type-checked before saving — errors are returned as diagnostics instead of being persisted), and verifies it with render_custom_graph. Ask for “a graph of our egress spend against the bandwidth metrics of the CDN droplets, with a toggle for daily/weekly” and pin the result.
Who infrastructure access runs as
A graph renders for anyone who can see the dashboard, so infra.* cannot run with the viewer’s permissions — it runs with the author’s: whoever last saved the script. Reads need the author to hold resources:read (storage:read for buckets); SSH, SQL, and KV need resources:execute. The check uses the author’s current role on every render, so a demoted or removed author’s graphs stop reaching infrastructure immediately. Editing someone else’s script makes you its author — you can’t borrow a more privileged author’s access by appending to their graph.
Sandbox and limits
Graph scripts run in the same QuickJS isolate as workflows, with a tighter budget: 30 seconds of execution, 64 MiB of memory, and per-run caps on cost queries, metric lookups, fetches, and data-store operations. The script is read-only over your organization — it cannot create, modify, or delete resources, fetch can only reach public addresses, and SSH is capped at 10 commands of 30 seconds each per render. The data store holds up to 200 keys of 64 KiB each, private to the graph.
Where they render
Web, desktop (cloud mode), and the mobile app all render custom graph cards, controls included — on the phone, selects become chip rows. Editing the script needs a code editor, so authoring lives on web and desktop; the phone adds existing graphs to dashboards and interacts with their controls.