Cost anomaly alerts
Automatic detection of unusual spend spikes and brand-new spend sources per provider and per service, with alerts through push, Slack, Microsoft Teams, and optional SMS.
Infrawrench watches your collected spend for anomalies. Once a day, after cost collection runs for your accounts, it compares yesterday’s spend for every provider and every service against that provider’s or service’s own trailing baseline. A day that lands far above the baseline raises an anomaly, which shows up on the Costs panel and — if you have notifications configured — arrives as a push notification, a Slack message, or a Teams card.
Unlike budgets, which alert when a monthly total you chose crosses a threshold you chose, anomaly detection works out of the box: the baseline is learned from your own history, so a spike stands out whether your org spends fifty dollars a month or fifty thousand. The thresholds it judges against can be tuned per organization when the defaults are too loud or too quiet. The third member of the family, change alerts, sits between the two: you configure a relative threshold — “this scope moved more than X% (or $Y) versus the prior period” — on a scope and cadence you choose, which catches the deliberate 15% creep that is never a statistical outlier and never crosses a budget.
Two kinds of finding
The anomalies list mixes two detections, marked distinctly:
- A spike — a provider or service spending far more today than its own recent history says it should.
- A new spend source — a provider or service that spent nothing at all across the trailing window and suddenly bills a material amount. This is the case no statistical test can catch: with a baseline of zero there is no average or deviation to exceed, so a jump from $0 to $5,000 clears no bar at all. It is also often the most important thing to see, because that is what a leaked key, a mistakenly enabled service, or a fat-fingered instance type looks like on a bill.
The two are mutually exclusive for a given day and key: anything with a baseline worth measuring against is judged as a spike, and only a key with no baseline can be a new source.
How detection works
- Detection runs against yesterday and the two days before it (UTC), never today — today is still accruing and would read as a dip, never a spike. Each pass re-judges that short window rather than only the newest day, because a day’s spend is not final when the day ends: providers restate late, and your accounts collect at staggered times, so a day looked at once and early can be missing most of its data. Re-judging it as it fills in is what stops a real spike from being missed.
- Each provider’s and each service’s spend is compared against its trailing 28-day baseline: the mean daily spend plus a number of standard deviations (three, by default). A day above that bar is a spike.
- A minimum absolute rise over the baseline ($10 by default, converted for other currencies) filters out penny-scale noise — a $0.02 day against a $0.001 baseline is many deviations out and still not worth an alert.
- Keys with fewer than 7 days of spend history are never judged as spikes: a brand-new service has no baseline worth trusting yet.
- A key that spent effectively nothing across the whole 28-day window and then bills more than the new-source floor ($25/day by default) is reported as a new spend source instead. “Effectively nothing” means it spent less over the entire window than that floor covers for a single day, which tolerates the sub-cent trial usage real bills are full of.
- New spend sources need 7 days of cost collection behind them before any are reported. On the day you connect your first account every provider and every service is technically new, and that is a fact about how long we have been looking rather than about your spend. This is measured across the organization, so a genuinely new provider or service inside an established organization still alerts the day it appears.
- Detection is per currency. Mixed-currency orgs get independent baselines per currency, the same way cost graphs never merge currencies, and every floor is converted so it means the same real amount whether a provider bills in dollars or yen.
Tuning detection
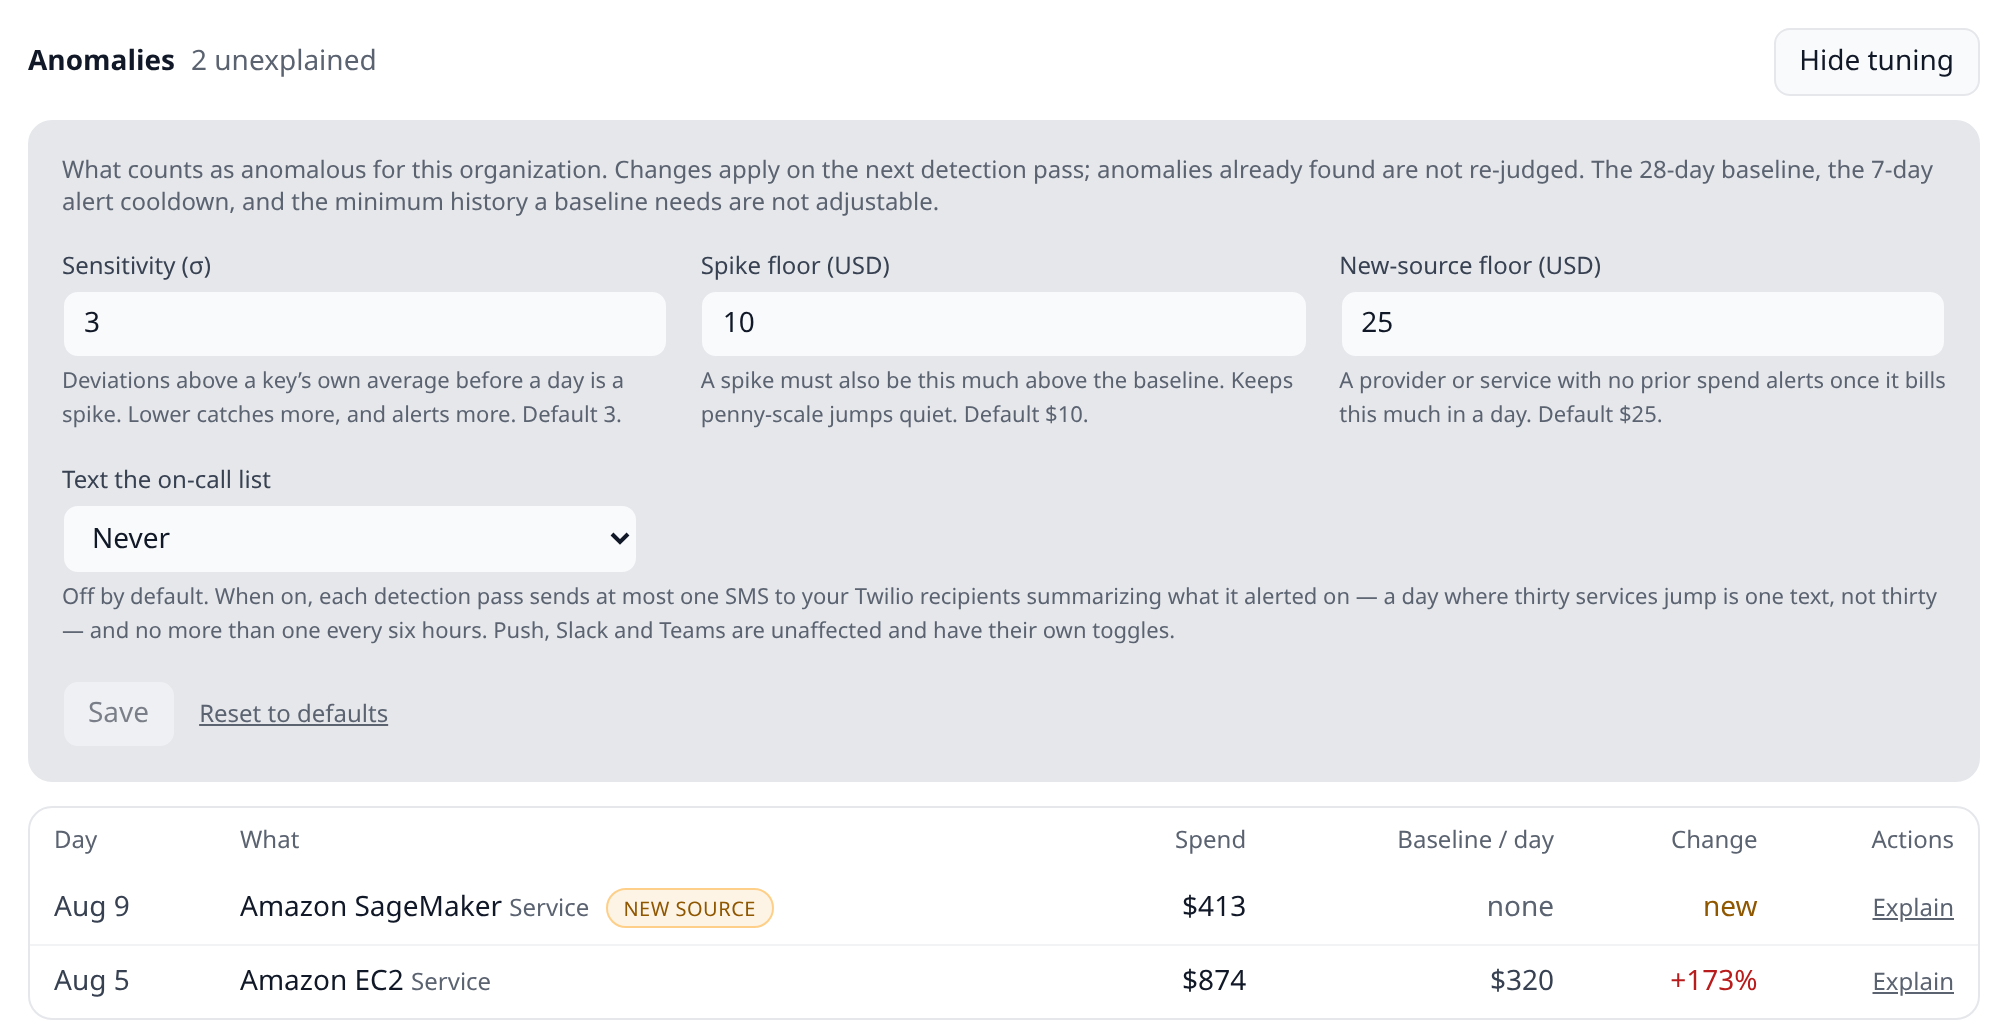
The Tune detection button on the Costs panel’s Anomalies section opens four controls, stored per organization:
| Control | What it does | Default | Range |
|---|---|---|---|
| Sensitivity (σ) | Standard deviations above a key’s own average before a day is a spike. Lower catches more. | 3 | 1 – 10 |
| Spike floor | The minimum rise over the baseline a spike must also clear, in USD. | $10 | $1 – $100,000 |
| New-source floor | The minimum first-day spend before a provider or service with no history alerts, in USD. | $25 | $1 – $100,000 |
| Text the on-call list | Whether anomalies also send an SMS — see Paging by SMS. | Never | Never / New sources only / Every one |
The bounds are enforced by the server, not just the form. A sensitivity of 0 would flag every day a cent above average, and anything under 1σ flags roughly a third of ordinary days; a floor of zero or less removes the noise filter entirely. The upper bounds exist so a typo — entering a floor in cents when the field asks for dollars — cannot silently switch detection off.
Everything else about the model is fixed: the 28-day baseline, the 7-day alert cooldown, and the minimum history a baseline needs are properties of the data rather than preferences.
Changes take effect on the next detection pass, which runs after the next cost collection. Anomalies already found are not re-judged, so lowering the sensitivity does not retroactively surface older days.
Reading the settings needs the costs:read permission; changing them needs costs:write — the
same scope as pushing your own cost rows, because retuning changes what your
whole cost feed alerts on. A member without it sees what detection is tuned to, without the
controls.
Tuning is a web and desktop feature. The mobile app lists anomalies but does not edit the thresholds or the SMS setting: they are organization-wide settings that change what everyone’s alerts look like, and the control you actually want on a phone — turning the notifications off for yourself — is the “Cost anomalies” toggle in the app’s notification settings.
Deduplication and cooldown
The same anomaly never re-alerts. Both kinds share these rules — a new spend source that keeps spending becomes an ordinary key with a baseline within days, and telling you about it every morning in between would be noise:
- Each (day, provider-or-service, currency) combination alerts at most once, no matter how many collection passes re-examine that day. If a day’s figures are revised upward by later data, the anomalies list updates to show the corrected amount, but no second alert is sent.
- After you are notified about a provider or service, further anomalies for the same one are suppressed for 7 days. A sustained price jump is anomalous against the trailing window for several days running; you get told once, not every morning. The suppressed days still appear in the anomalies list so the record is complete.
- The cooldown counts only anomalies that actually reached you. An anomaly detected while no channel was connected — or one whose delivery failed — does not start a quiet period, and stays eligible to be sent for as long as its day is still in the evaluation window. Connect Slack, Teams, or mobile push and the next collection pass delivers what is still pending.
Root-cause hints
An anomaly tells you spend went up; the hints try to tell you why. When an anomaly fires, Infrawrench looks at what else it already knows about the same window — the change timeline and the audit log for the anomalous day and the day before — and attaches up to three short facts, ranked by how likely they are to explain a bill:
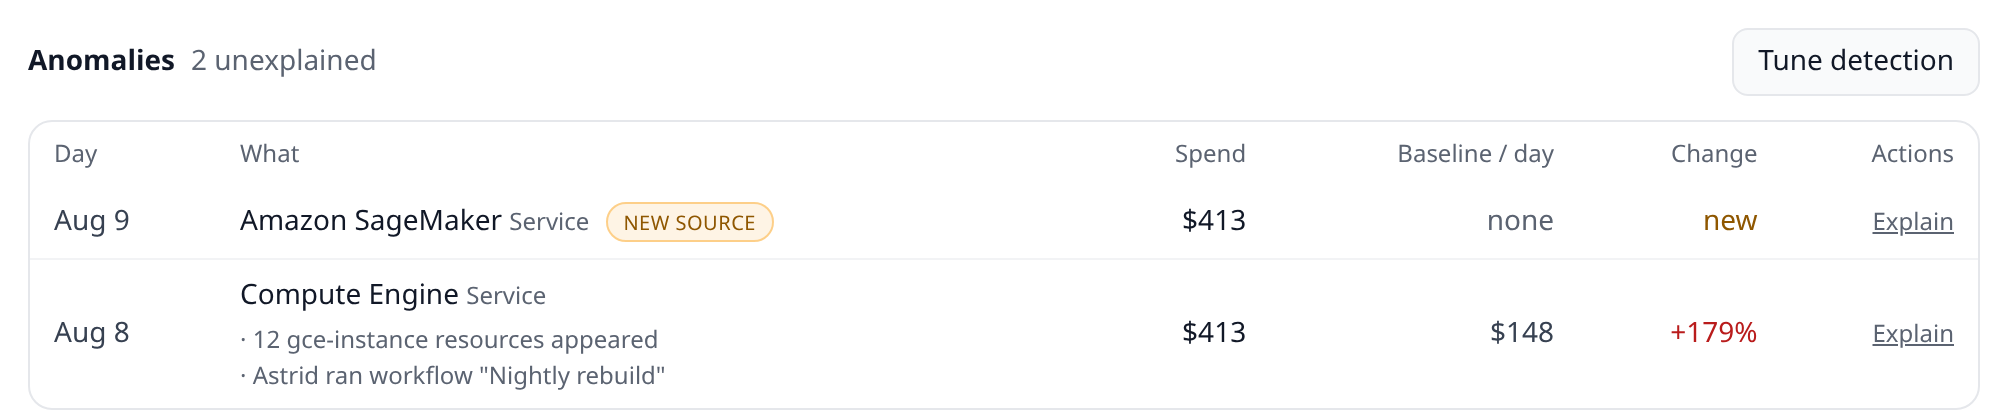
- Resources that appeared, changed, or disappeared, aggregated by type — “12 gce-instance resources appeared”. For a provider anomaly only that provider’s resources are considered; a service anomaly can’t be pinned to one provider generically, so it reads org-wide.
- Audited actions that plausibly cost money, with the actor’s name where one is recorded — a workflow run (“Astrid ran workflow “Nightly rebuild""), a change freeze lifted or overridden, a deployment, resources created from Infrawrench, a sleep/wake schedule change. Actions performed with an API key are attributed to “an API key”.
The hints appear in the Slack message and Teams card body, as a single “likely related” line on the push notification, and under each row in the Anomalies list on web, desktop, and mobile. SMS texts never carry them — the text’s length budget is already spent naming the anomalies themselves. Hints are computed once, when the anomaly is first detected, so an anomaly found before a related change landed in the timeline is not re-annotated later.
They are hints, not verdicts: the queries find correlation in time, scoped to your org (and provider where possible), and an empty list just means nothing notable was recorded in that window.
Where anomalies appear
The Costs panel (web and desktop) has an Anomalies section listing the last 30 days:
the day, what spiked, the actual spend, the baseline it was measured against, and the
percentage change. New spend sources carry a New source badge, and show none for the
baseline and new for the change — a key with no prior spend has no percentage to be up by.

The mobile app shows the same list on its Costs tab, under the month-to-date chart and your budgets, with the same distinction between the two kinds. Tapping a cost anomaly push notification opens the moment view — the anomaly in context with everything else that happened around it, with Costs one tap away. An anomaly somebody has explained carries an Explained badge and the sentence, so the person who gets the push at 7am is not working out a spike that was settled yesterday. Detection thresholds, and writing an explanation, are read-only there — see below.
From the CLI
The desktop CLI prints the same list:
infrawrench costs --anomalies              # the last 30 days
infrawrench costs --anomalies --days 7     # a shorter window (1-90)
infrawrench costs --anomalies --last 2w    # the same window, said the other way
infrawrench costs --anomalies --json       # stable JSON for scripting
It is a flag on costs rather than a command of its own: it answers a question about the same data the chart draws. Text mode prints a table of the day, what spiked (the provider or service, and which of the two it is), the actual spend, the trailing baseline per day, and the percentage change — new where the key had no baseline to be up from. New spend sources are marked [new source] and print none for their baseline. A notified column shows the day the alert was delivered, or a dash for anomalies detected while no channel was connected or inside another anomaly’s cooldown.
An explained column carries the first line of the explanation for any finding somebody has
explained, or a dash for one nobody has. Explaining itself is a web and
desktop action — it publishes a note onto charts, which is not a thing to do blind from a
terminal — but the MCP tool acknowledge_cost_anomaly covers scripted and agent use.
The --json output carries a kind field on every row (spike or new_source), so a script can route the two differently, and the full acknowledgement object where there is one.
<insert [Terminal showing infrawrench costs --anomalies output: the table of day, what spiked, actual vs baseline spend, the red percentage-change column, and the notified column] here>
Alerts
Anomaly alerts ride the same channels as budget alerts and sync-failure incidents. Everything lives under Settings → Notifications, in two places:
- Slack and Microsoft Teams — which channels get anomalies is decided by the Alert routing rules, not by a checkbox on the channel row. Add a rule whose Trigger condition names Anomalies and pick the channels under Send to. Until you write any rules, the built-in default sends every trigger except Drift to every connected channel, so a freshly connected workspace already receives them — see Alert routing.
- Mobile push — a per-user, per-org toggle labelled Anomalies, in the Mobile app pane of the Connections box (under “Your mobile notifications”), or on the mobile app’s own Settings → Notifications screen. It defaults to on.
Slack and Teams messages carry a “View in Infrawrench” button that opens the Costs panel.
Paging by SMS
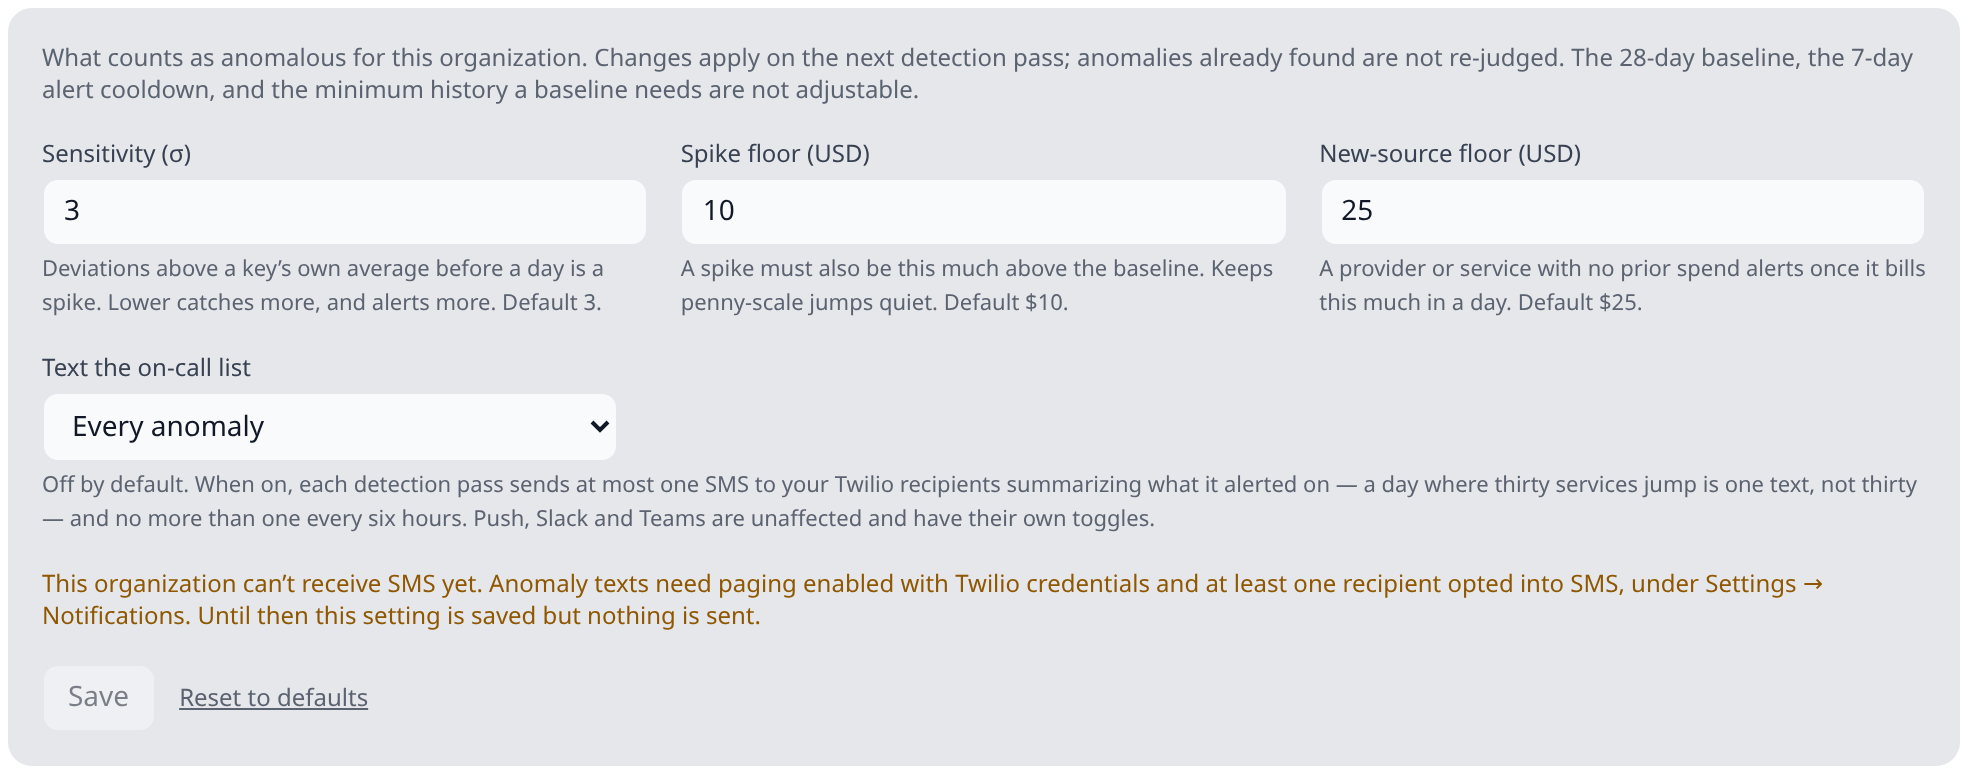
Anomalies can also text your on-call list through the org’s Twilio credentials. It is off by default and turned on with the Text the on-call list control in the tuning panel, which offers three settings:
| Setting | What gets texted |
|---|---|
| Never (default) | Nothing. Push, Slack and Teams are unaffected. |
| New spend sources only | Only a provider or service that started spending from nothing — the shape a leaked key or a mistakenly enabled service takes. |
| Every anomaly | New sources and spikes on existing lines. |
It defaults to off deliberately: an organization that already configured Twilio for budget alerts and sync incidents should not start receiving a new category of text message because a release shipped.
One text per detection pass, not one per anomaly. A single pass can flag many anomalies at once — detection runs per provider and per service, so the day one account’s spend jumps you get a provider anomaly plus one for every service underneath it. The text summarizes what that pass alerted on: the day, the three largest findings by detection order, and a count of the rest (“and 9 more”). The Costs panel has the full list.
At most one text every six hours per organization, on top of the 7-day per-key cooldown. The evaluation pass itself can run hourly, and the per-key cooldown only stops the same provider or service alerting again — without a second bound, a trickle of different services crossing the threshold as late-restated data lands could text somebody all day. A suppressed text loses nothing: the anomalies are still stored, still listed, and still delivered to push, Slack and Teams.
Never a voice call. Twilio voice is reserved for workflow pages that ask for it. An anomaly is worth a text, not a ringing phone at 3am.
Texts need paging enabled for the organization with Twilio credentials and a from-number under Settings → Notifications, and at least one recipient opted into SMS. If none of that is set up, the tuning panel says so rather than accepting the setting and silently delivering nothing.
API
Recent anomalies are available over the HTTP API:
GET /api/org/{orgId}/costs/anomalies?days=30The endpoint requires the costs:read permission and returns up to 200 anomalies from the
requested window (1–90 days), newest first. Each row carries a kind of spike or
new_source; rows detected before new-source detection existed read as spike. For a
new_source, baselineCents is zero or near it — do not compute a percentage change from it.
Each row also carries hints — the root-cause hints computed when the
anomaly fired, as an array of up to three strings, empty when nothing notable happened in the
window or the row predates hint collection. The CLI’s costs --anomalies --json output
includes the same field.
Each row also carries acknowledgement — null while the finding is still an open question,
and otherwise the explanation, when it was recorded, who recorded it, and annotationId: the
cost annotation it created. annotationId is null once that
note has been deleted, which removes the marker and never the acknowledgement. The annotation
carries the reverse of the link as costAnomalyId, so a marker on a chart is traceable back to
the finding it closed.
Explaining a finding is a costs:write POST:
POST /api/org/{orgId}/costs/anomalies/{anomalyId}/acknowledge
{ "explanation": "Migrated the API fleet to Graviton" }
The reply is the updated anomaly. The annotation’s date (the anomalous day) and its org-wide scope are derived server-side and are not part of the body — a client that could date the note would be a client that could put the marker on the wrong bar. Posting again replaces the sentence and rewords the note rather than filing a second one, and will not recreate a note that has been deleted. It does not suppress anything: a later spike on the same key is a new anomaly.
The thresholds are readable and writable too:
GET /api/org/{orgId}/costs/anomaly-settings
PUT /api/org/{orgId}/costs/anomaly-settings
GET needs costs:read and answers with the defaults for an organization that has never
changed them. PUT needs costs:write and replaces the whole object — sigmas,
minDeltaCents, newSourceMinCents, and smsAlerts (off | new_source | all) are all
required, and out-of-range values are rejected with a 400 rather than clamped. smsAlerts
deliberately has no server-side default: a client that omits it is rejected rather than
silently switching an organization’s SMS paging back off.
Both responses also carry a read-only smsConfigured boolean — whether a text raised right now
could actually be delivered (paging enabled, Twilio credentials stored, at least one recipient
opted into SMS). It is derived, and is not accepted on PUT. See the
API reference for the full schema.
Explaining an anomaly
Detection finds a spike; a person works out that it was a deliberate migration. Without somewhere to put that, the knowledge dies in their head and the next person to open the chart asks the same question.
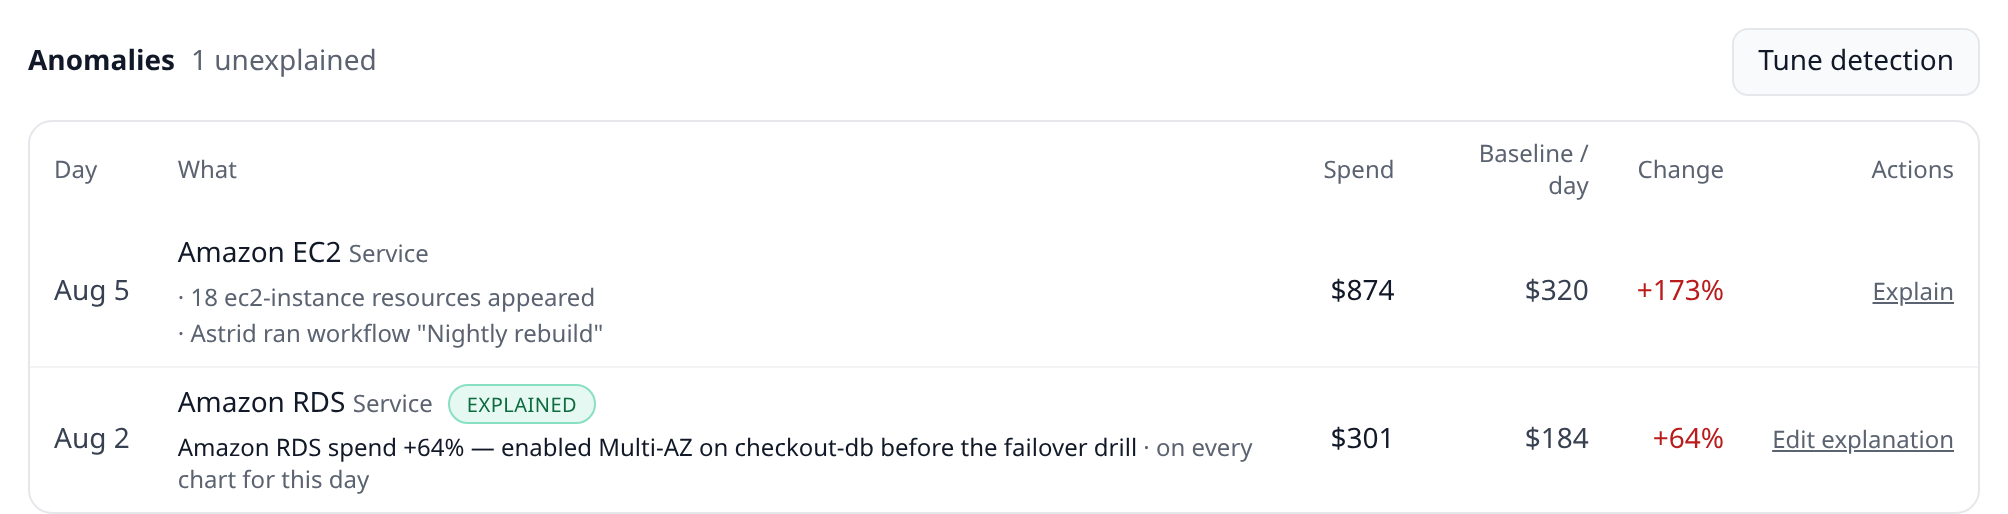
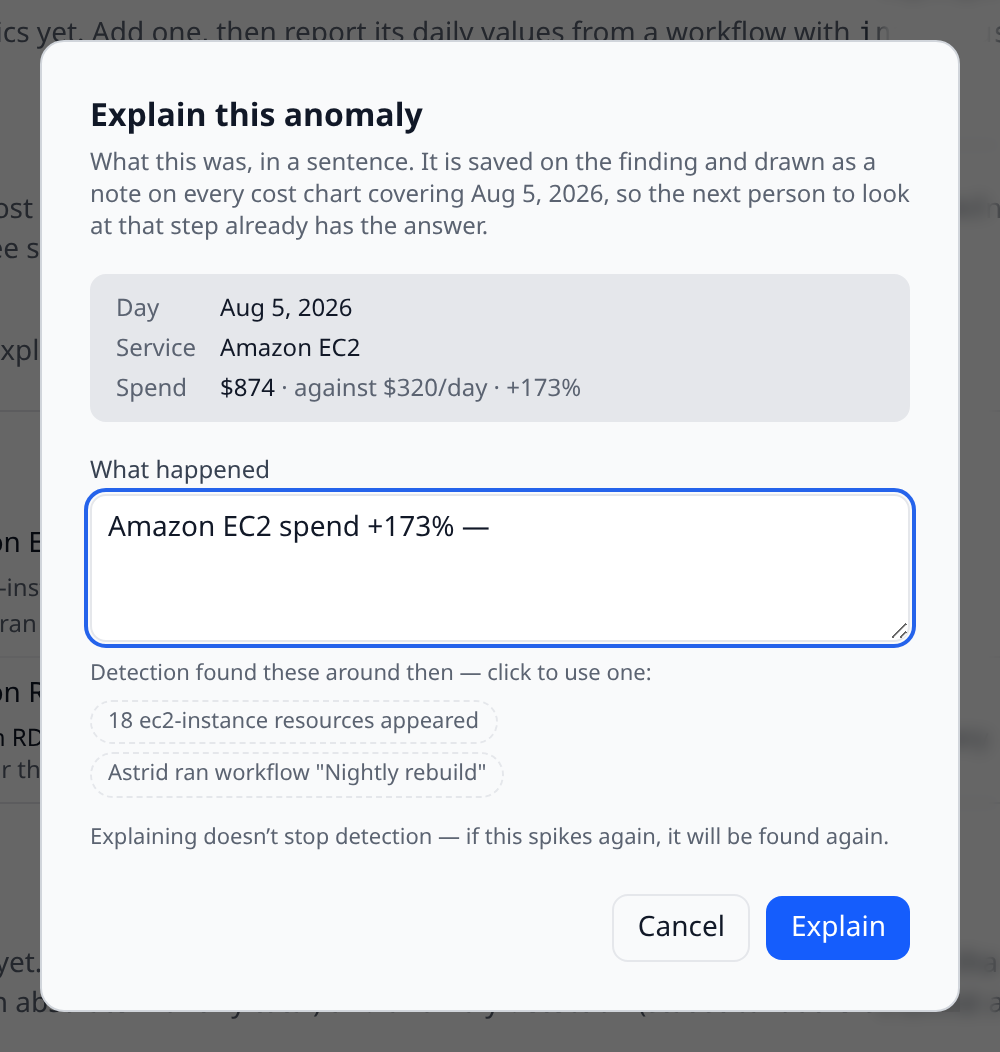
Explain on an anomaly row opens a small composer. It is prefilled with what the row already knows — “Amazon EC2 spend +173% — ” — so you finish a sentence rather than compose one, and any root-cause hints detection collected are one click away as a starting point. Saving does two things:
- Records the explanation on the finding. The row is marked Explained, shows the sentence inline, and stops counting towards the “N unexplained” total next to the section heading.
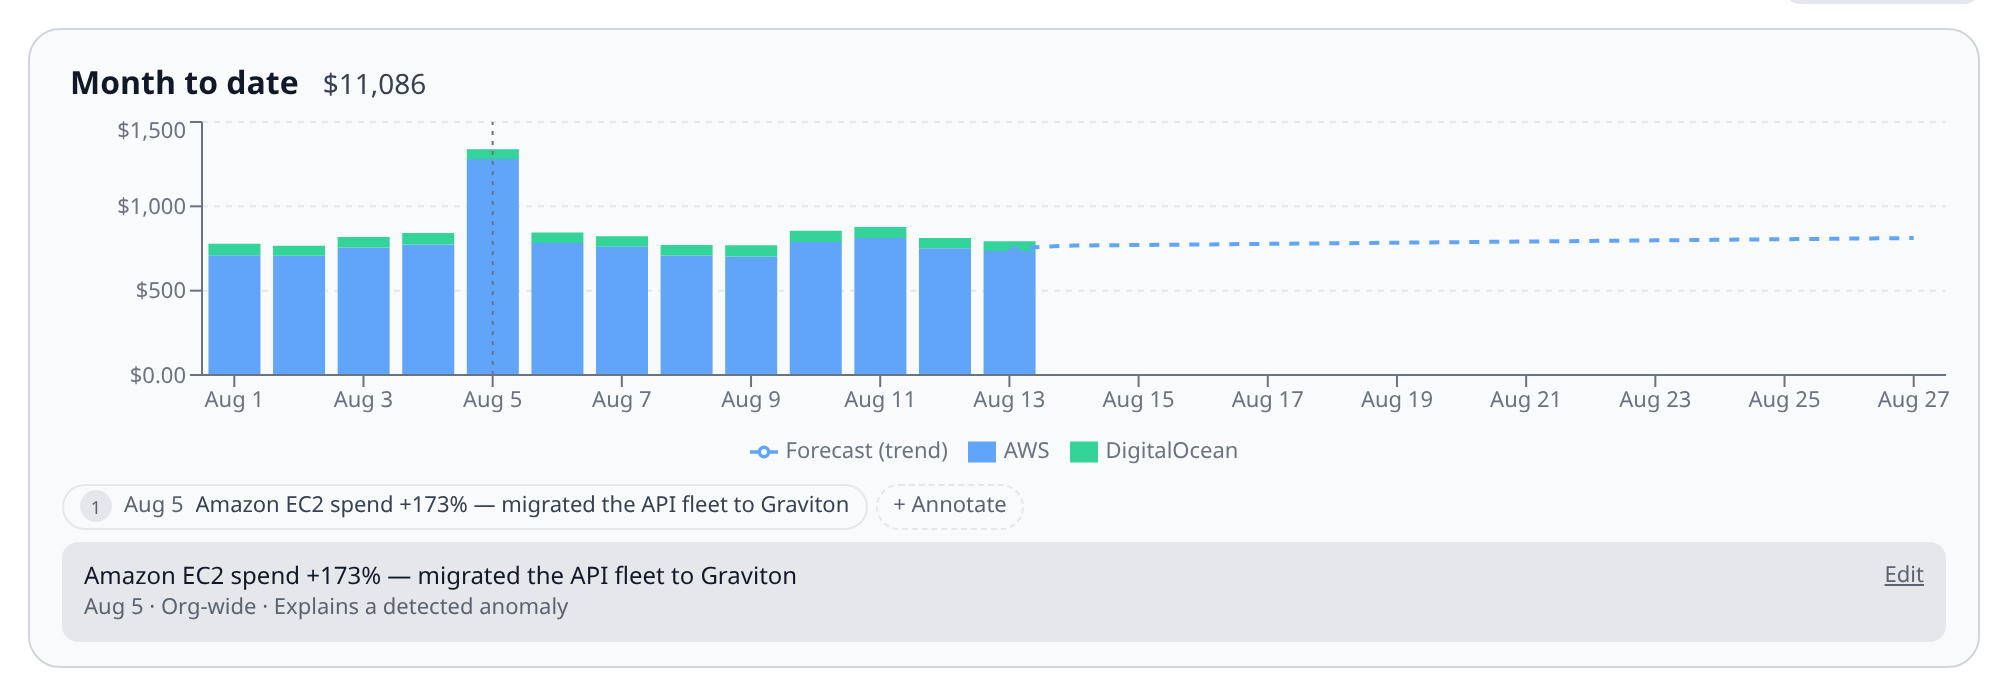
- Creates a cost annotation at the anomaly’s day, scoped org-wide, so the explanation is drawn as a marker on every cost chart covering that day — the report, the dashboard card, the overview. That is the whole point: “we migrated the fleet” is not a fact about whichever chart you happened to have open.
The note’s date and scope are derived from the anomaly and are not editable in the composer; there is nothing there to get wrong. Afterwards the note is an ordinary annotation — you can reword it, narrow it to one report, or move its date from the annotation editor like any other.
A few consequences worth stating plainly:
- Explained rows are marked, never hidden. The detection was correct and the record matters; hiding it would lose the history and invite somebody to work the same spike out from scratch.
- Explaining does not suppress detection. If the same provider or service spikes again on a later day, that is a new finding and it is detected and alerted on exactly as before. An explained spike is explained, not exempt. There is deliberately no “mute this key” — the silencing that does exist is the 7-day notification cooldown, which is about not paging twice for one level shift and knows nothing about explanations.
- Deleting the annotation does not reopen the anomaly. The marker disappears from the charts, the row keeps its explanation and stays out of the unexplained count, and the list says the note was removed. Somebody did work out what that spike was, and deleting their chart marker is not a retraction of it.
- Editing an explanation rewords the existing note rather than adding a second marker to the same bar. If the note was deleted, the correction updates the record without putting the marker back.
Explaining needs costs:write — the same permission the annotation it creates needs. Reading
the list, and any explanations on it, needs costs:read. Each acknowledgement is written to the
audit log.
Explaining is a web and desktop action. The mobile app shows an explained anomaly — the badge and the sentence — but does not compose one: the note it creates lands on charts you are not looking at from a phone, and the answer is what mobile owes you at 7am.
Filing an anomaly as an issue
An anomaly usually needs someone to go and look at something. If your organization has Jira or Linear connected, each row on the Anomalies table carries a file link that opens an issue prefilled with the day, the dimension, the spend, the baseline, the percentage over, and any root-cause hints already computed for it. Once filed, the row shows the issue key instead, so the same spike doesn’t get raised twice.
The two actions sit next to each other and answer different questions: file it when somebody needs to go and look, explain it when you already know. A row often gets both — filed on the morning it fired, explained the afternoon somebody found the cause.