# Dependency graph
See how your resources are wired together — read from your synced cloud data and from output references — and what breaks if one of them goes down.
The **dependency graph** draws your infrastructure's wiring across every provider and account in the organization. Most of it is already there the first time you open it: each sync stores what a provider says about a resource, and that includes the pointers — an EC2 instance's VPC, a droplet's project, the IP a DNS record answers with. The graph reads those back out. [Output references](../core-concepts/output-references.md) you wire yourself are drawn on the same canvas.
Open it from the **Graph** tile in the sidebar, on web or desktop.
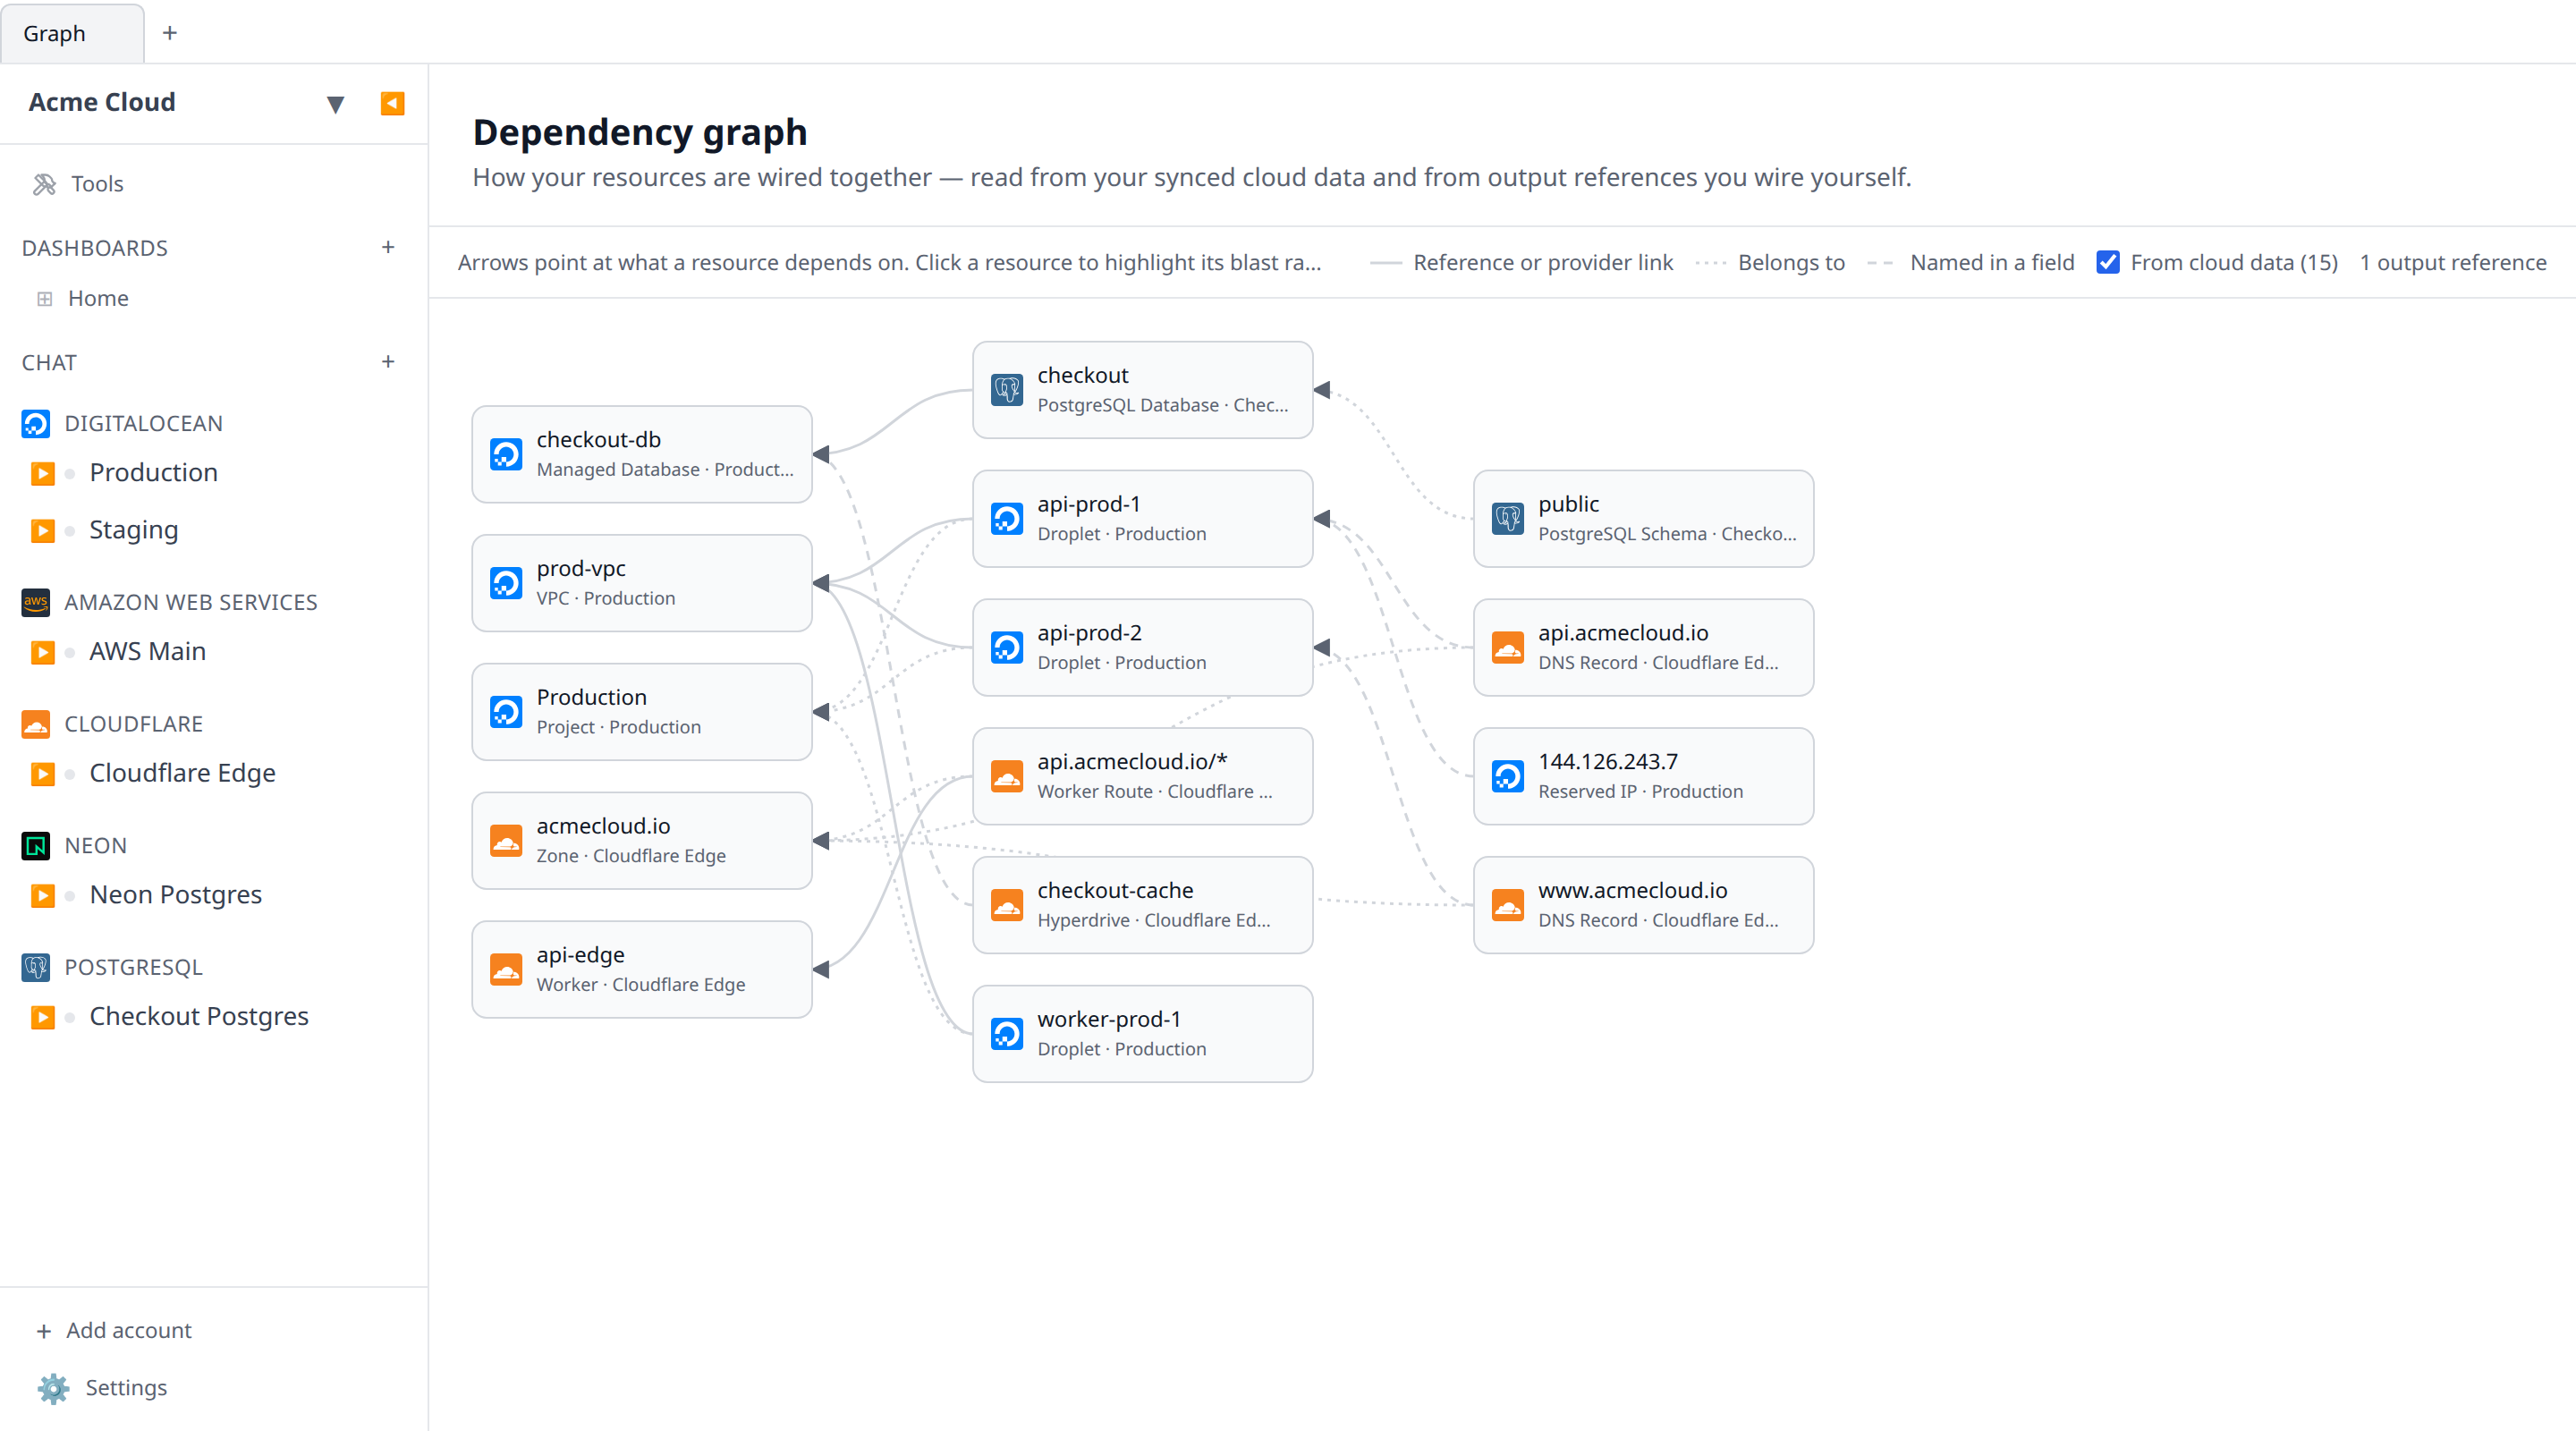
## Reading the graph
- **Nodes** are resources. Each shows its provider logo, name, type, and account.
- **Arrows point at what a resource depends on.** A Postgres account whose connection string references a managed database points at that database.
- **The line style says how certain the link is** — solid for a stated relationship (an output reference you wired, or one the provider plugin declares), dotted for a resource that belongs to another (a deployment in its cluster), dashed for a field value that happens to name another resource.
- Resources with no links in either direction stay off the canvas — the graph is about wiring, not inventory.
Providers sit on the left, and everything that consumes them fans out to the right, so the deeper a chain goes the further right it ends up.
The **From cloud data** checkbox in the header hides everything except output references, which is how you see what is wired through Infrawrench rather than what the provider already had.
## Identical resources are grouped
Providers mint fleets of resources that are the same fact repeated — a GCP auto-mode VPC has one `default` subnet per region, every one of them named `default` and attached to the same network. Drawn separately they'd fill the canvas with a dozen identical tiles.
The graph merges them into a single tile marked **×12**, drawn as a small stack. Grouping is deliberately conservative: resources merge only when they are indistinguishable _both_ by label and by wiring — same provider, type, account and name, attached to exactly the same neighbours in the same directions. Give one of those subnets a VM and it stops being interchangeable, so it keeps its own tile.
Select a grouped tile and choose **Show all** to break it open; **Regroup** in the header puts everything back. The **Group identical** checkbox turns the behavior off entirely.

## Blast radius
Click a node to see its **blast radius**: the resource itself plus everything that transitively depends on it. The dependents stay highlighted while the rest of the graph dims — if the selected resource breaks or rotates its outputs, the highlighted set is what's affected.
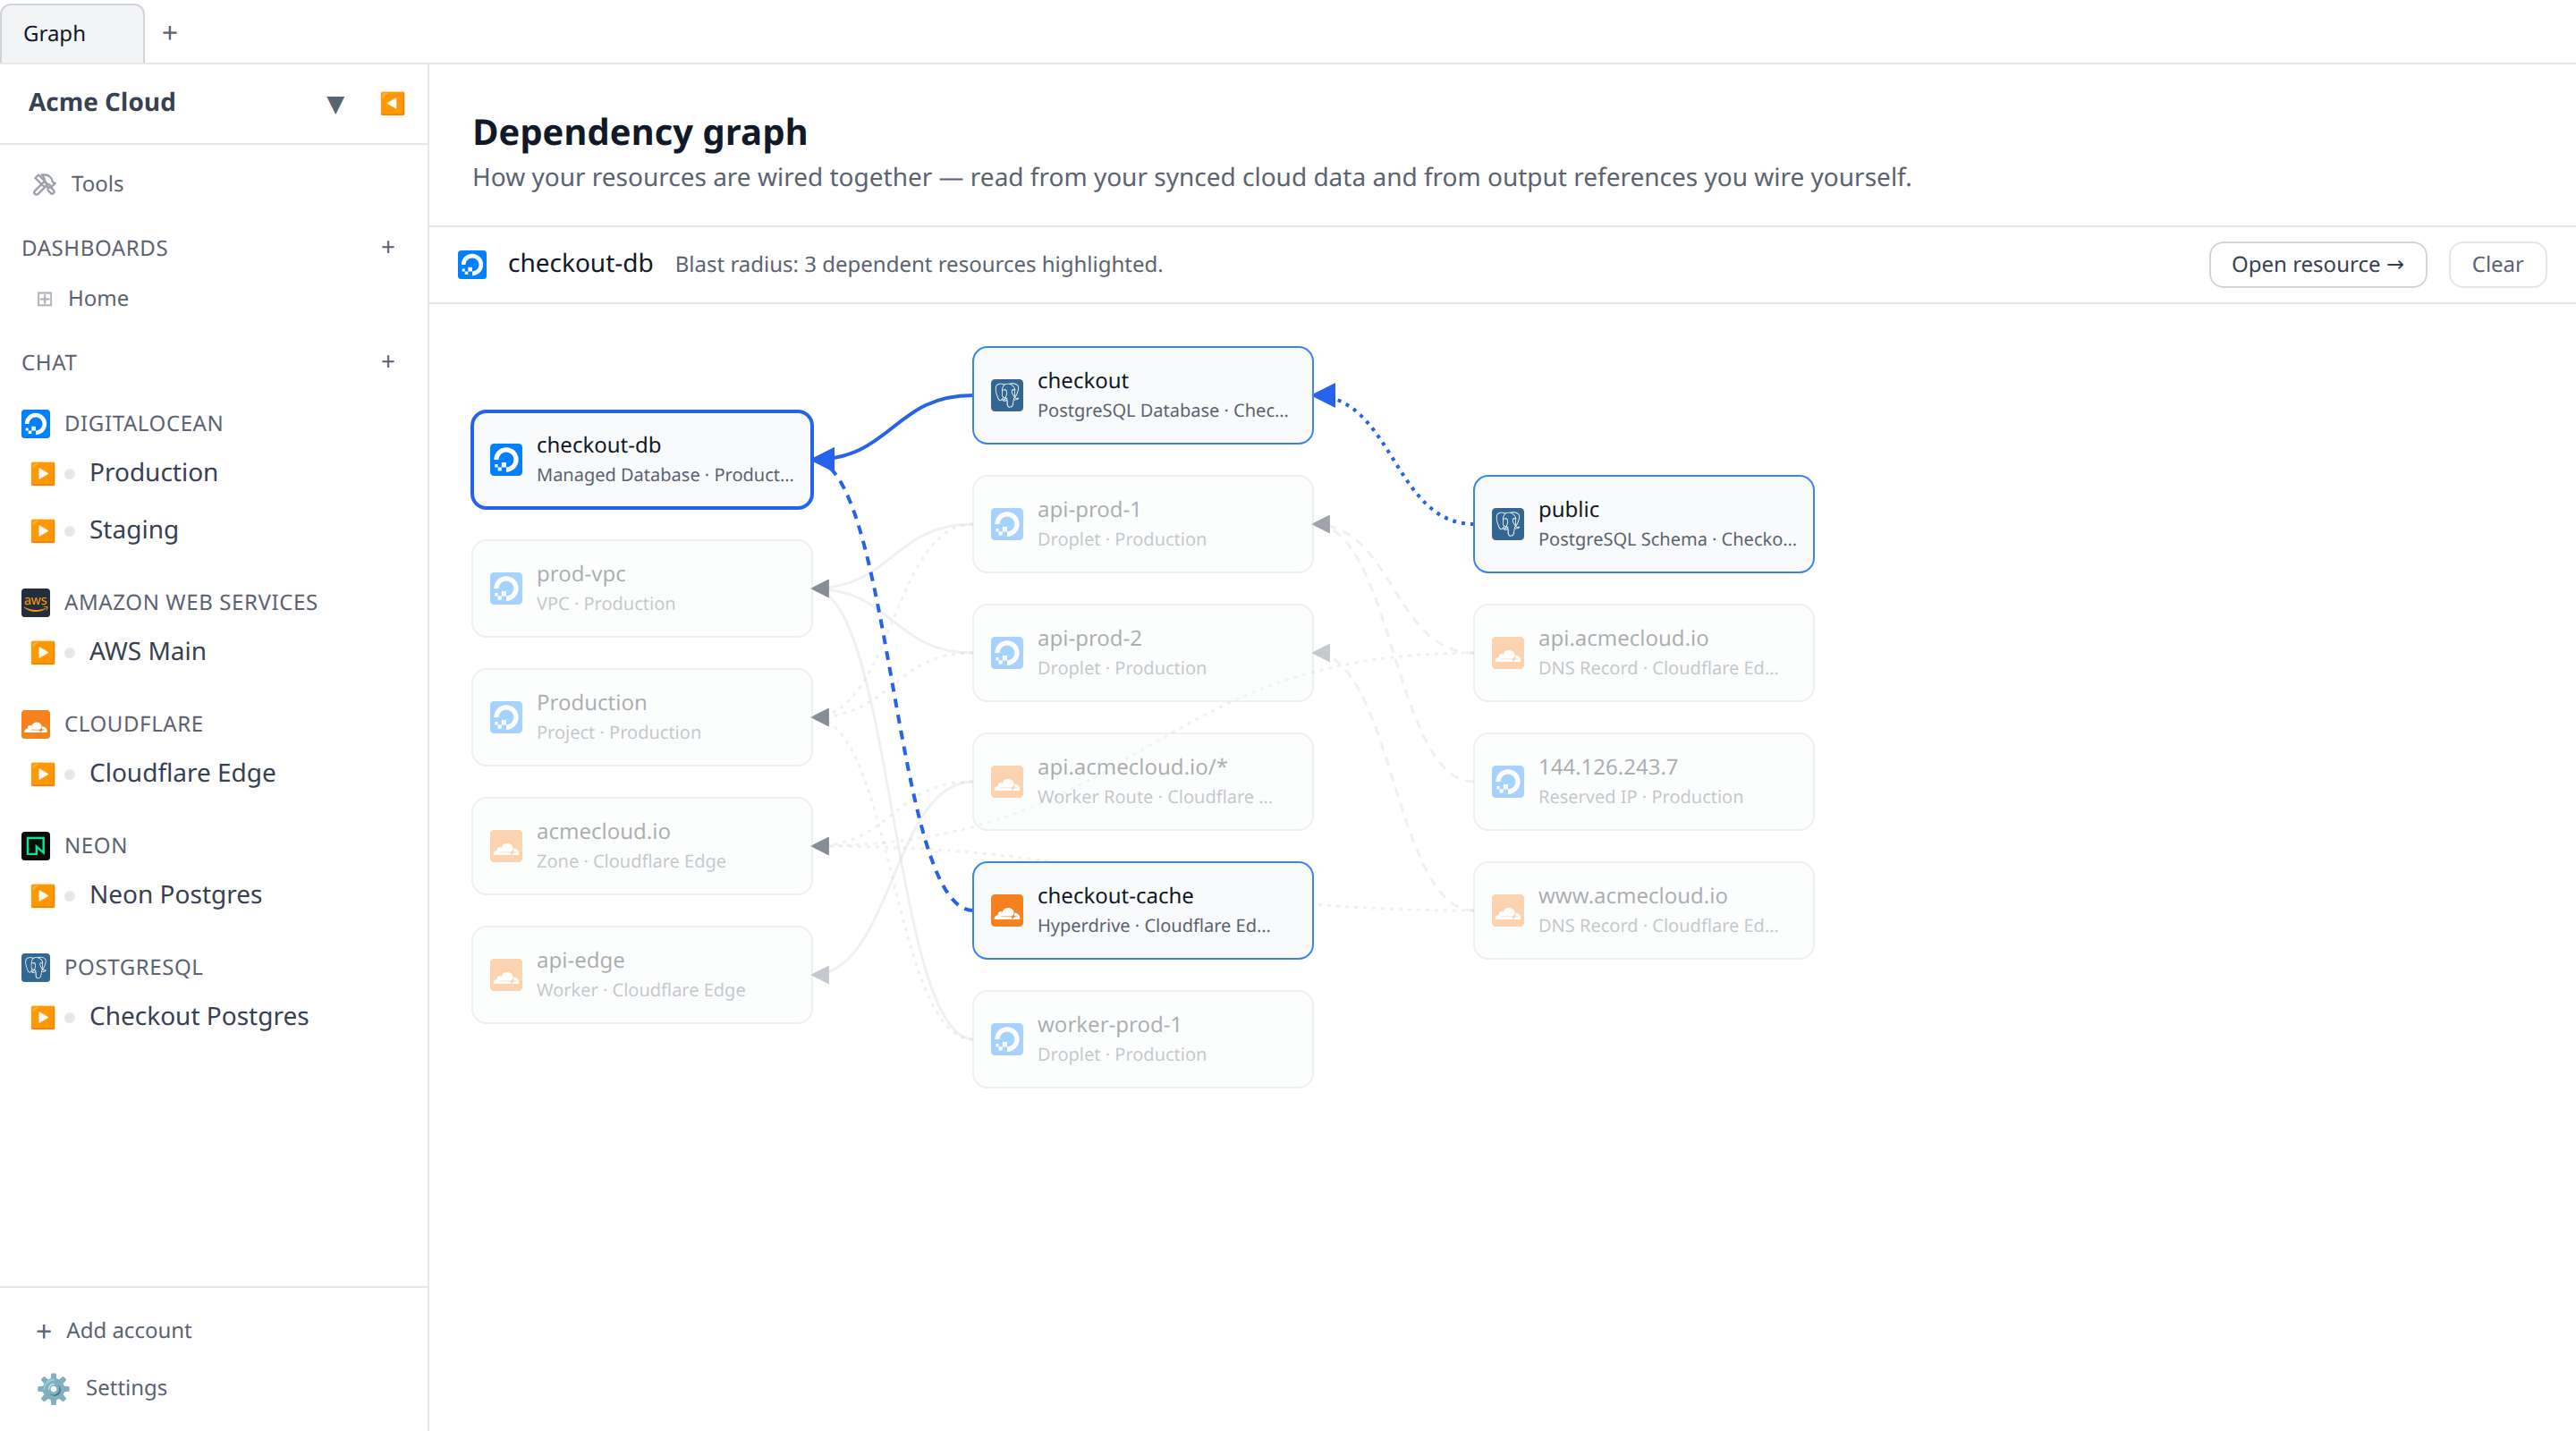
Click the selected node again (or the **Open resource** button in the header) to jump to its detail page.
The canvas highlight is the graph's share of the answer. The full [blast radius](./blast-radius.md) report adds what the graph cannot see — the dashboards, probes, alerts, leases and schedules that point at the resource, what measurably talks to it, and what couldn't be checked — and it is what the delete confirmation dialog shows.
The graph is keyboard navigable: Tab moves between nodes, Enter or Space selects the focused node and then opens it, and Escape clears the selection. Clicking empty canvas or the **Clear** button in the header clears it too.
## Per-resource dependencies
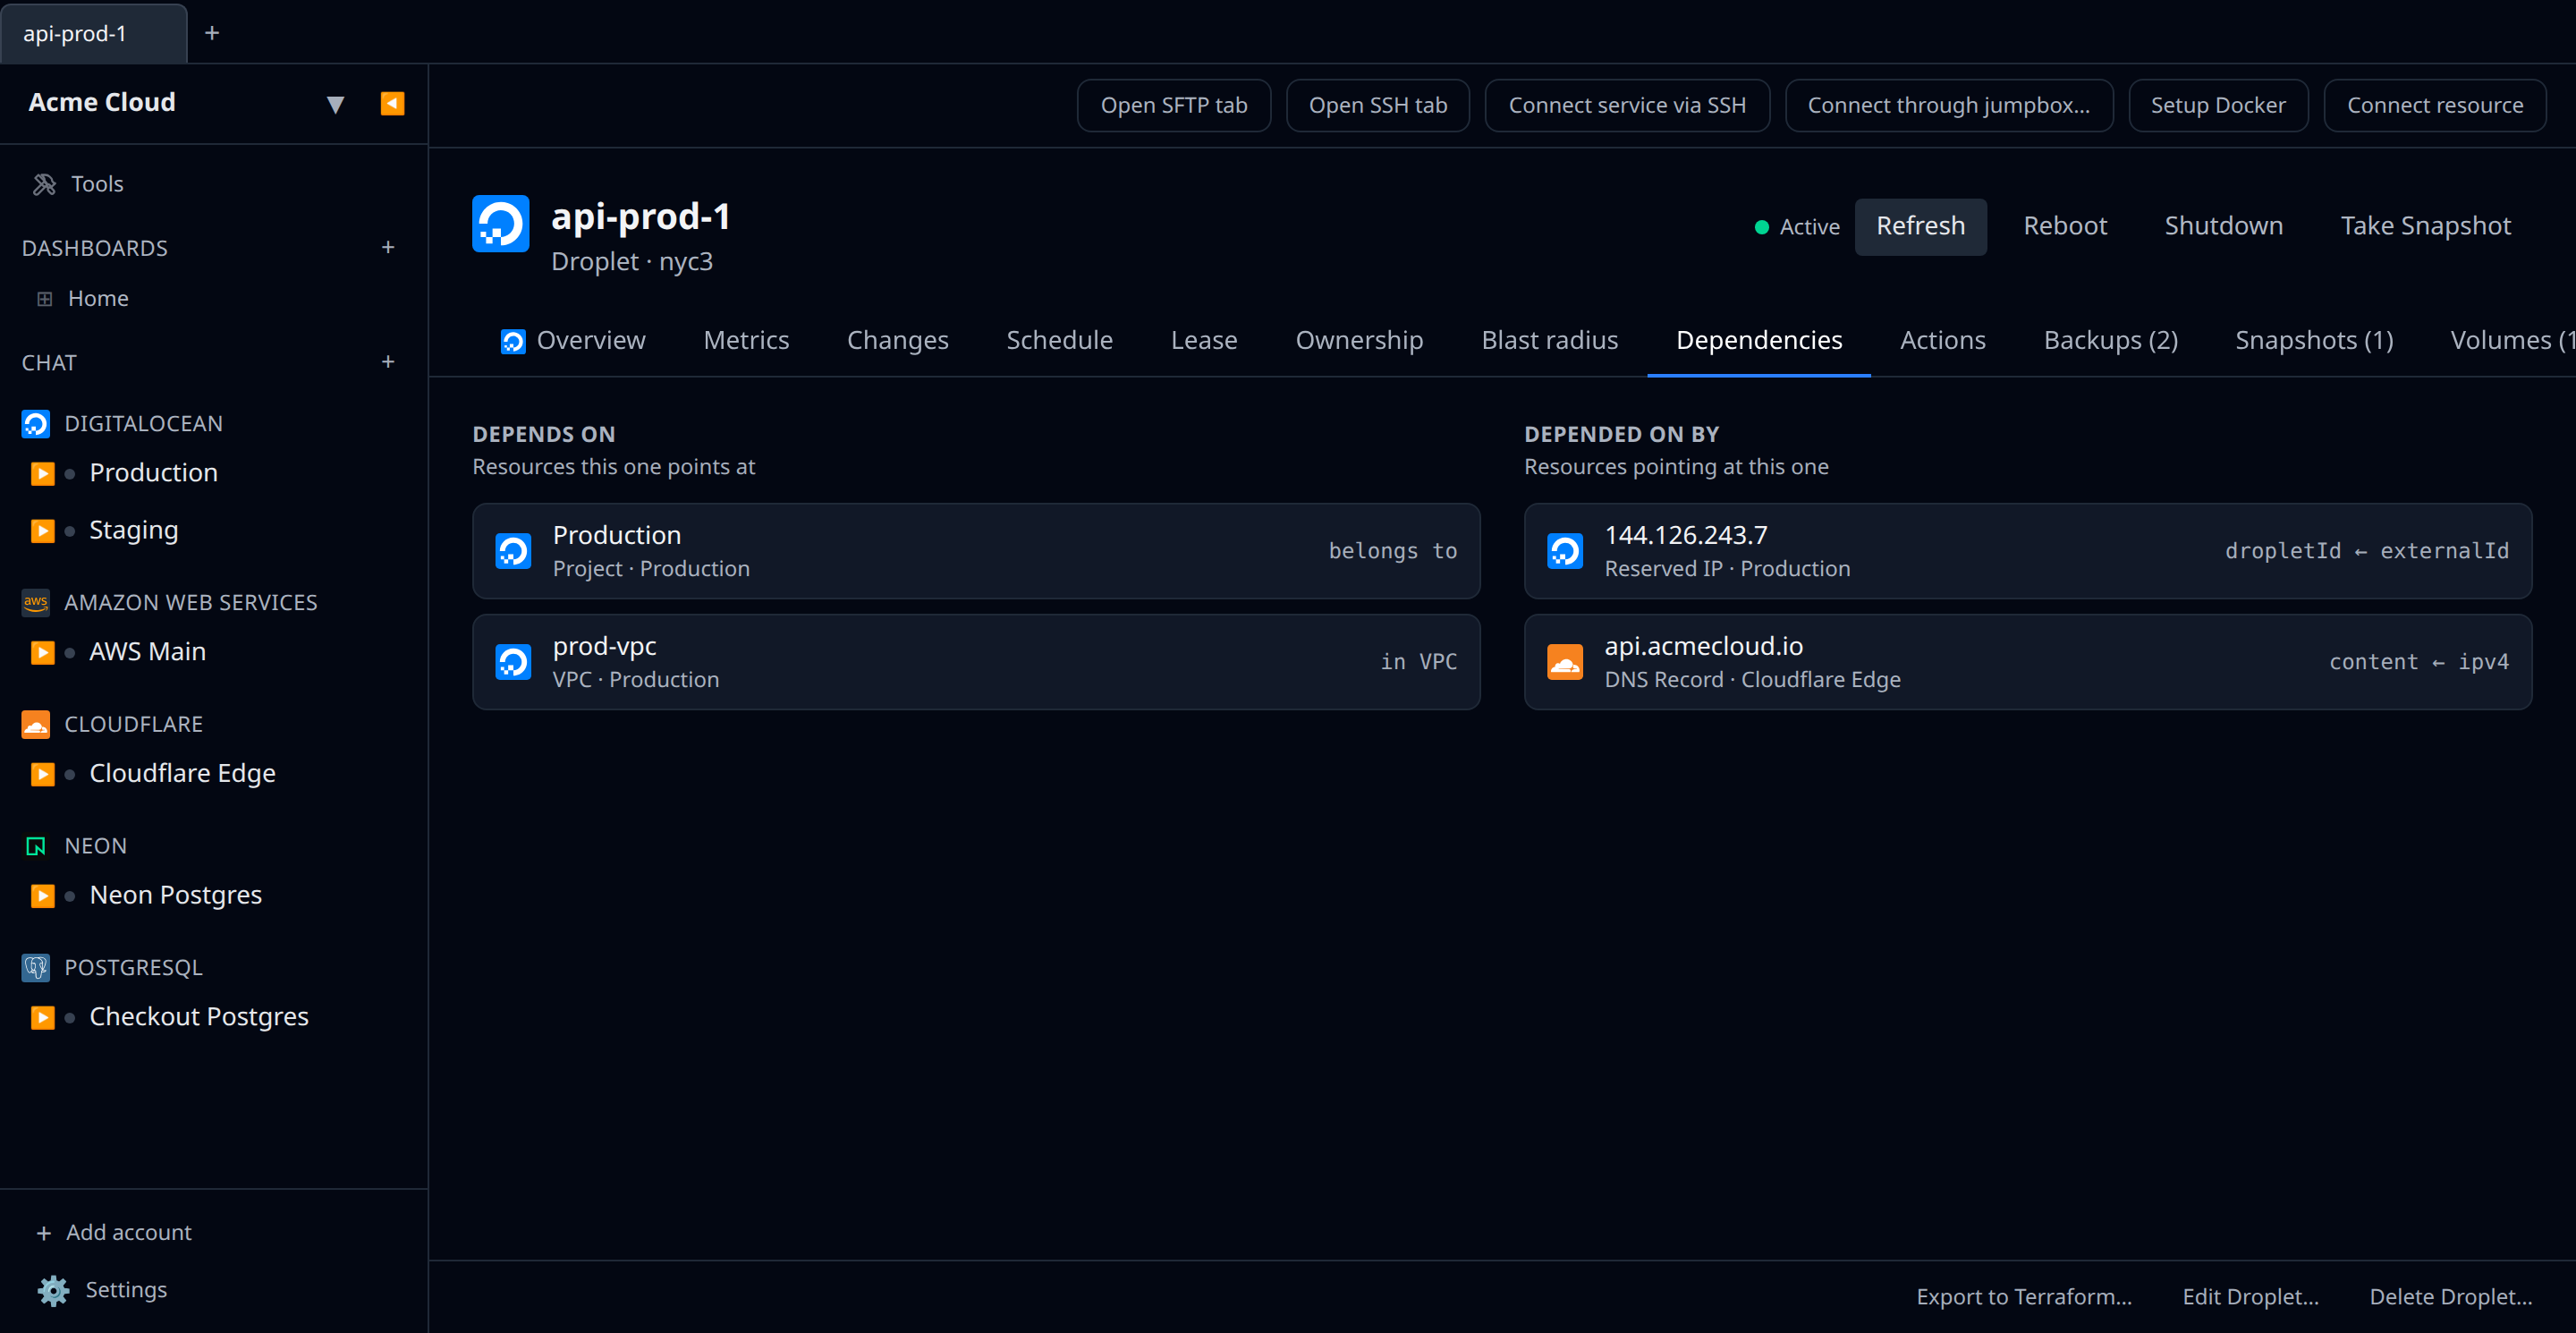
Resource detail pages get a **Dependencies** tab whenever the resource participates in the graph. It lists direct neighbors in both directions:
- **Depends on** — the resources this one points at, captioned with the relationship: the plugin's own wording where it has one ("in VPC"), the field and output behind the link otherwise, or "belongs to" for the resource hierarchy.
- **Depended on by** — the resources pointing at this one.
Each entry links to the neighbor's detail page.
## On your phone
The [mobile app](./mobile-app.md) has the per-resource half, not the canvas. Every resource page carries a **Dependencies** section with the same two lists and the same captions, and each entry opens its neighbor.
**Blast radius** on that section opens a screen for the focused resource: what it depends on and what depends on it, both as indented trees that follow the chain rather than stopping at direct neighbors, headed with the count of everything that transitively depends on it. A `↺` marks a link back to a resource already on the branch, and `…` marks a branch stopped at the depth limit — the same conventions the CLI uses.
The org-wide canvas stays on web and desktop. Its value is seeing a whole topology at once, which is exactly what a phone screen can't give you; the question you actually have on a phone — what does this touch, and what breaks with it — is what the trees answer.
## Where the data comes from
Four sources, all of them already in the app — nothing to configure:
1. **Output references.** Wire a field to another resource's output and the edge appears; switch the field back to a literal value and it disappears. These are the same links that power [secret rerolls](../core-concepts/secret-rerolls.md) and automatic re-resolution.
2. **Links the provider plugin declares.** A plugin can state that a given field points at a given resource type — an EC2 instance's `vpcId` is a VPC, its security group list is security groups. These edges are exact, and they get the plugin's own wording ("in VPC", "guarded by") instead of a field caption.
3. **Resource hierarchy.** Anything synced as a child of another resource — a Kubernetes deployment in its cluster, a database in its project — is drawn as belonging to its parent.
4. **Field values that name another resource.** Each sync stores the resource's fields; when a value exactly matches another resource's identity — its provider id, name, endpoint, hostname or IP — that's an edge.
The last source is a match rather than a statement, so it errs toward silence: a value claimed by two resources is dropped rather than guessed at, and a value that isn't obviously machine-generated (a plain name like `staging`) only matches inside the account it came from. Declared links have no such doubt, which is why they're drawn solid alongside output references.
Not every provider declares its links yet — the ones that don't still get the inferred edges, and gain the exact ones as their plugin adopts them. Either way there's nothing to switch on: connect an account, let it sync, and the topology fills in.
Very large organizations can produce more links than the canvas can usefully draw. When that happens the graph says so in a banner and shows a partial view — a single resource's **Dependencies** tab still shows its complete neighbourhood.
On the web app the graph covers everything in your organization. On desktop it covers the resources stored on that machine, and switches to the organization-wide view when you're signed into cloud sync. On mobile there is no canvas — see [on your phone](#on-your-phone) above.
## From the CLI
The [desktop CLI](./cli.md) draws the same topology as an ASCII tree:
```sh
infrawrench graph # the whole organization as a forest
infrawrench graph --resource # one resource: what it needs, and its blast radius
infrawrench graph # same thing, positionally
infrawrench graph --json # the node and edge lists, for scripting
```
Without a focus, roots are the resources nothing depends on, and each child is something its parent depends on — so reading down a branch walks toward the things everything else is built on. A `↺` marks a link back to a resource already on the branch (references can be circular), and `…` marks a branch stopped at the depth cap.
With `--resource`, the output is the terminal's version of the **Dependencies** tab: a **Depends on** tree and a **Depended on by** tree, the second headed with the blast-radius count — every resource that transitively depends on this one.
`--json` emits the graph itself — `nodes` and `edges`, plus `truncated` — and, when focused, adds the direct `dependsOn` / `dependedOnBy` neighbour lists and a `blastRadius` array of resource ids.
The command reads the organization's graph, so it needs cloud sync; the desktop app's **Graph** tile is what covers a local-only workspace.
## API
Programmatic access is available at `GET /api/org/{orgId}/dependency-graph`, which returns the node and edge lists (see the [API reference](../team-and-billing/openapi.md)). Each edge carries a `kind` — `output-ref`, `declared`, `containment` or `field-match` — saying which of the four sources it came from, an optional `label` when the plugin worded the relationship, and the response's `truncated` flag says whether the graph was capped. It requires the `resources:read` permission.